Gold Stays Blah Despite The Rah-Rah


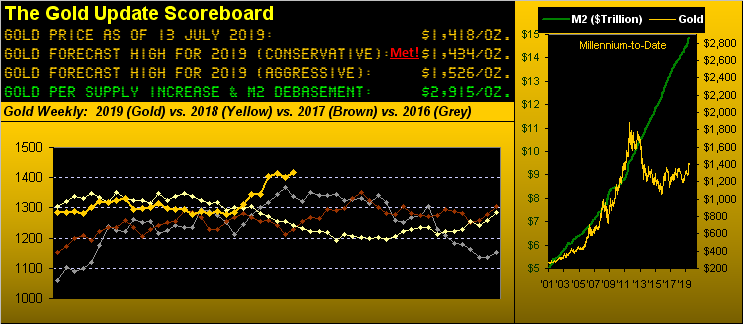
Now don't take that title too negatively: 'tis nothing short of marvelous to finally find Gold well up and away from The Box (1280-1240) which had been its centerpiece trading area for the last six years, let alone just four weeks ago having reclaimed Base Camp 1377 en route to then reaching our "conservative" forecast high for this year of 1434 on 25 June. Those who understand the Gold Story never gave up through these six years, and as great as 'tis to be "where we is" there's an ever so long road ahead -- and it ain't no straight superhighway -- toward making an All-Time High above 1923 and moreover merely getting price aligned with StateSide currency debasement, which by the above Scoreboard Gold ought rightly be 2915 right now. "Whew!"
Yet all that said, regular readers of The Gold Update know we don't delve into what our great and good fellow writers put forth in analyzing our beloved market, simply so as to not bias our own thinking about that which we're seeing. But neither are we entirely aloof to the array of headlines we encounter about the yellow metal. And given price's robust up move of late, there's consensus that for Gold's great ascent we need no longer wait -- that "This is IT!" And "IT" it may very well be. Hence the hyped "Rah-Rah".
Still, through the nearly ten years of cranking out this weekly missive, our approach remains to emphasize from where Gold's price has come, what now 'tis, and what is realistic to expect. This is akin to the approach voiced by the late, great Howard Cosell to (employ drawn-out Brooklyn accent here) "Telllll it like it IS!"
And "what it is" at present is a Gold price having settled yesterday (Friday) at 1418, a scant four points above the 1414 centrum of the last three weeks across the high-to-low range of 1443-1385. Further, "what it is" is pretty much what we anticipated would be the case upon price having recently made it to (and a tad through) 1434. That's because:
■ When we first selected 1434 as a forecast high, 'twas indeed for last year -- but then not having reached that level -- we again selected it for this year as 'twas far overdue and certainly achievable; plus
■ 1434 was also a level 'round which we sensed Gold would then -- for at least some material amount of time -- get stuck. And that is exactly what's happened. Hence the honest "Blah".
Behold the daily price of Gold since we first put 1434 on the table at the beginning of 2018 right though today, the top line in the graphic being that 1434 level:

"But your scoreboard still also says 1526 for gold this year, mmb..."
That is similar to your "up the road" query from two weeks ago, Squire, since which time 1434 obviously has garnered additional recognition as resistance. The last time 1526 traded was on 12 April 2013: two trading days later found price at 1434. 'Twas Gold's swiftest move through space ever recorded since the turn of the millennium. And whilst we've not ruled out this year's "aggressive" 1526 forecast high, let's acknowledge:
■ that Gold is now in a consolidation pattern;
■ that Base Camp 1377 has yet to be tested as support; and
■ that the mid-1400s were fraught with all kinds of trading consternation from April into May of 2013.
So barring something on the order of the Federal Open Market Committee opting for a 50-basis-point rate cut come 31 July, or the world ending (by which the children over at Barron's would likely write "The Dow Went Up 2 Points Because It Wants to Look Good for Incoming Aliens"), Gold's price may well reside right 'round these lower 1400s/upper 1300s for some time. Now that's "tellin' it like it is". And showing as so are the weekly bars:
As for the Fed, per that from their Head, 'twould seem they'll be reducing their Bank's Funds rate spread from the present 2.25%-2.50% target range downward to a 2.00%-2.25% target range. To be sure, such reduction already is priced into the FedFundsFutures. But the Dollar really hasn't backed off that much (the Dollar Index itself have sported nearly a 2% low-to-high gain these past three weeks), whilst the price of the Bond has fallen from where 'twas a week ago, in turn pushing the long-end of the yield curve up from 2.502% on 03 July to 2.670% yesterday. Slap on the anticipated rate cut et voilà the curve shall have re-steepened a bit.
As for the percentage tracks of the five primary BEGOS Markets from one month ago-to-date (21 trading days), here they are with, yes, both the Bond and Euro (vis-à-vis the Dollar) actually underwater despite expectations of a FedFunds rate cut. 'Course, the Euro isn't getting a "Whole lotta love"given the European Union having just cut its own growth forecast for next year:
Meanwhile, the Economic Barometer gained a skosh this past week primarily due to leaps that were not foreseen for the core readings of both the Producer and Consumer Price Indices in June, whilst May's Wholesale Inventories were worked down. Here's the Econ Baro with the S&P 500 moving up into the uncharted 3000s, (our "live" price/earnings ratio for which is now 33.3x and the 1.950% yield below that of the 10-year T-Note's 2.106% return ... are you lettin' it all ride on the stock market?) Either way, the largest graphical divergence we've ever recorded between the Baro and the S&P continues. Oh goodie:
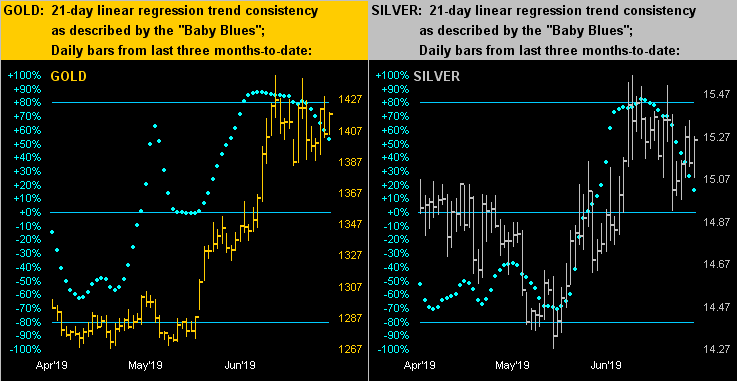
As to what we're technically seeing near-term for the precious metals are the accelerating declines in the "Baby Blues" of linear regression trend consistency for both Gold on the left and Silver on the right across their respective last three months of daily bars. Our rule of thumb based on some twenty years of review is upon the blue dots dropping below their +80% axis, look to lower price levels near-term. The white metal has already tested the prior structural support that you can see in the upper 14s; but the yellow metal -- Base Camp 1377 notwithstanding --- doesn't exhibit like structural support until the 1360s/1350s:
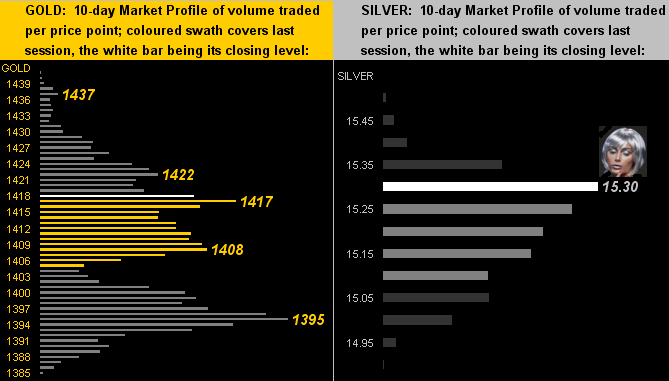
As for trading throughout the past fortnight, both Gold (below left) and Silver (below right) are fairly centered just above their 10-day Market Profile midpoints, the former's support and resistance levels as labeled. But for Sister Silver, she's lettin' it all ride on one level at 15.30:
To wrap it for this week on a wryly humourous note, the aforementioned Barron's framed the week's Congressional testimony by Fed Chair Powell with this blah:
■ Pre-Powell: "The Dow Slipped 23 Points Because Nothing Matters Until the Fed’s Powell Talks"
■ Post-Powell: "The Dow Jumped 228 Points Because Sometimes the Fed Isn’t the Most Important Thing"
Will you kids please make up your minds? We offer Gold as an inarguable example: just own it! Rah-Rah!
www.deMeadville.com
www.TheGoldUpdate.com
********

Mark Mead Baillie has had an extensive business career beginning in banking and financial services for two years with Banque Nationale de Paris to corporate research for three years at Barclays Bank and then for six years as an analyst and corporate lender with Société Générale.
For the last 22 years he has expanded his financial expertise by creating his own financial services company, de Meadville International, which comprehensively follows his BEGOS complex of markets (Bond/Euro/Gold/Oil/S&P) and the trading of the futures therein. He is recognized within the financial community of demonstrating creative technical skills that surpass industry standards toward making highly informed market assessments and his work is featured in Merrill Lynch Wealth Management client presentations. He has adapted such skills into becoming the popular author each week of the prolific “The Gold Update” and is known in the financial website community as “mmb” and “deMeadville”.
Mr. Baillie holds a BS in Business from the University of Southern California and an MBA in Finance from Golden Gate University.


