Gold Still Lacks Sally with the S&P's Relief Rally


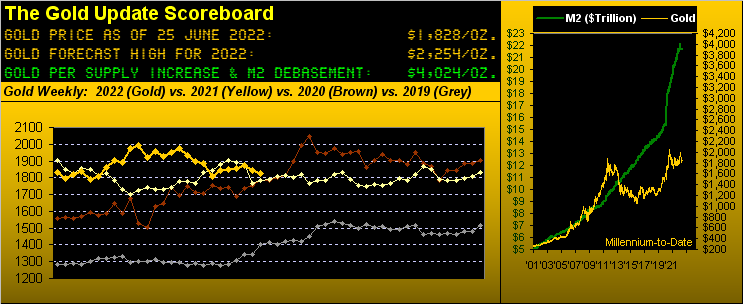
Did you know -- and if you truly follow the price of Gold you knauseatingly know -- that the 12-point price range (rounded to the nearest whole point) of 1836-1848 has traded within each of the past seven consecutive weeks? A mere glance at the above Gold Scoreboard -- whilst without such level of detail -- basically bears that out. "Bears...Grrrr..."
Regardless, whether we again reprise Isaak's  "Goin' Nowhere"['95] or even reach back to The Vandellas' "Nowhere to Run"['65], Gold these days clearly exemplifies being on the Talking Heads' "Road to Nowhere"['85].
Yet the hits just keep on comin'. So intrigued are we by Gold's seven weeks of stalemate that we've put together the following graphic (likely an analytical global Gold first) of price displayed in seven week bars from the All-Time High of 2089 in August 2020-to-date, (which is from 99 weeks ago across 15 bars). And given Gold not having gone "off the scale" throughout, 'tis rather like a musical composition that one might deem as an étude entitled "Gold in Seven-Week Bars" perhaps by Mendelssohn. 'Course, it hardly has the range and gaiety of "A Midsummer Night's Dream" [1826]; rather 'tis more of a boringly repetitive scale which even since that leftmost "high note" remains essentially directionless:
In fact from the 2089 high to Gold's settling the week yesterday (Friday) at 1828 is a decline of -12%. For the same stint, the U.S. money supply ("M2") is +19%. Yes it flies in the face of functionality, but even as the light-bulb of perceived wealth flickers ever dimmer on Wall Street, Gold is just not garnering the bid, yet...
But from the "Just Beware Dept." (for those of you scoring at home), the S&P 500's +4% relief rally this past week now places the Index's market capitalization at $34.3 trillion vs. the present M2 level of "only" $21.7 trillion. Which in turn (for you WestPalmBeachers down there) means for every $1 invested in the S&P, there's just 63¢ available from the entire liquid money supply to pay you upon capitulation. "Got Gold?"
Specific to the S&P's relief rally, 'twas well-anticipated throughout the daily Prescient Commentary of late, as penned back on 17 June that "...by our MoneyFlow page, the 5-day measure suggests the S&P 'ought be' +118 points above its present level of 3667 (at 3785). Too, by Market Values, the [S&P futures are] ... -402 points below [their] smooth valuation line..." Add to that -- with the S&P now up to 3912 -- it nonetheless remains "textbook oversold", although such condition can be fully unwound come Monday. Moreover -- this relief rally notwithstanding -- the S&P futures contract finds its linear regression trend (21-day basis) reinforcing its negativity such there we sense there's not much upside "umph" left in the S&P pump. Further, the 3600-3200 support zone has yet to be tested. More so, as you regular readers know, should the Economic Barometer be the harbinger of a "no growth" Q2 Earnings Season, that puts S&P 2900 on the table as the "live" price/earnings ratio reverts -- per its historical wont -- from today's 31.3x to the mean of 22.3x.
Speaking of the Econ Baro, here 'tis (blue line) with the rightmost relief rally for the S&P (red line). The Bloomy quote therein is ascribed to the "On What Planet is the IMF Living? Dept.":
So just for the IMF crew to review, in REAL StateSide terms:
■ GDP Q1 2021: +2.1%
■ GDP Q2 2021: +0.6%
■ GDP Q3 2021: -3.7%
■ GDP Q4 2021: -0.2%
■ GDP Q1 2022: -9.6%
■ GDP Q2 2022: -?.?%
Such clearly recessive negativity herein noted (in other words, as ignored by the balance of the FinWorld at large), there were two bright spots for the Econ Baro this past week. One: May's New Home Sales were an upside shocker in sporting their second-best month-over-month percentage gain (+10.7%) in nearly two years, perhaps as folks move to lock in still relatively low fixed mortgage rates. Two: there weren't that many other notable incoming metrics to add to the Baro's woes, (save for a decline in Existing Home Sales, the third largest increase in the Current Account Deficit in the 24-year history of the Econ Baro, and the lowest University of "Go Blue!" Michigan Sentiment Survey we've also ever recorded). Other than that, everything's great.
Staying with the stagflation theme, per the Conference Board, some 60% of CEOs see the U.S. as in recession come next year. To translate for your ten-year old, most company presidents thus don't realize the U.S. economy is already shrinking. Include Federal Reserve Chair Powell in that bunch as well for testifying to Congress this past Wednesday that the Bank's rate hikes could cause a recession (in which comprehensively we already are).
But not to worry as St. Louis FedPrez James "Bullish" Bullard looks for the StateSide economic expansion (what?) to continue, (your laughter out there is infectious). Someone please fax to him the Econ Baro.
And to put a cherry on top (or better stated on the bottom), S&P/Experian's "Consumer Credit Default Indices" rose in May for the sixth straight month. Variable rate debt is a beautiful thing, (not).
Far from beautiful is Gold's ongoing parabolic Short trend, now 13 weeks in duration. Albeit in going nowhere, price has effectively stabilized in this year-over-year view, (oh nice add-on there, Squire).
"Just showing it like it is, mmb..."
And as has been the case for some nine weeks running, the Gold/Silver ratio as noted remains over 80x at 86.5x. "Got Silver?"
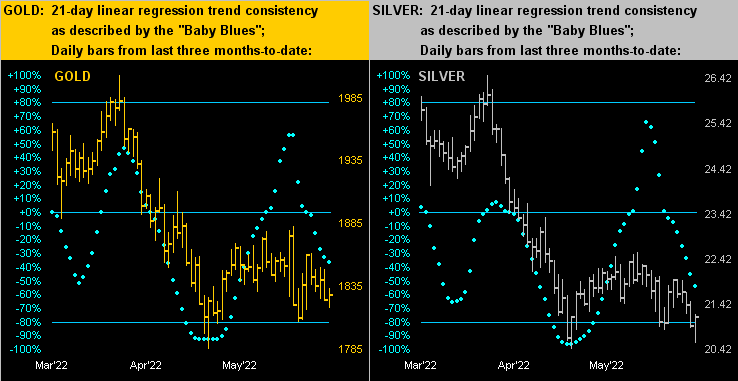
Meanwhile, the near-identical pattern of both Gold and Silver drudges onward in sideways display as we next see here with the yellow metal on the left and the white metal on the right across their respective past three months. The declining "Baby Blues" in both cases depict their trends' negativity as gaining downside consistency, Gold itself again dealing with its underlying structural support zone which spans from 1854 to 1779:
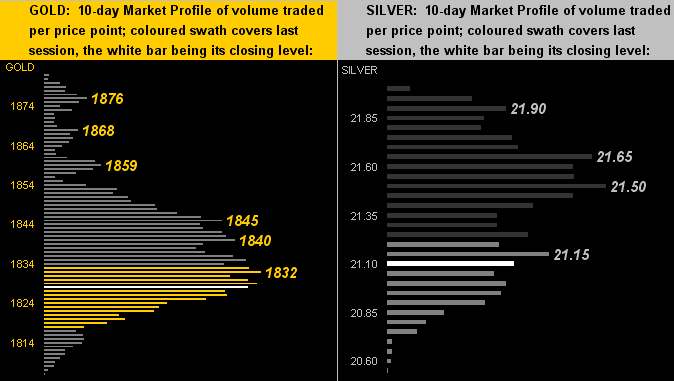
The 10-day Market Profiles for the two precious metals therefore lack sally. Be it Gold (below left) or be it Silver (below right), being "below" resistance seems the appropriate preposition:
Below which, in turn, we've The Gold Stack:
The Gold Stack
Gold's Value per Dollar Debasement, (from our opening "Scoreboard"): 4024
Gold’s All-Time Intra-Day High: 2089 (07 August 2020)
2022's High: 2079 (08 March)
Gold’s All-Time Closing High: 2075 (06 August 2020)
The Weekly Parabolic Price to flip Long: 1914
The Gateway to 2000: 1900+
Structural Support Zone: 1854-1779
10-Session “volume-weighted” average price magnet: 1838
The 300-Day Moving Average: 1834 and rising
Trading Resistance: per the Profile, notably 1832-1845
Gold Currently: 1828, (expected daily trading range ["EDTR"]: 28 points)
Trading Support: none of note by the Profile
10-Session directional range: down to 1806 (from 1883) = -77 points or -4.1%
The Final Frontier: 1800-1900
The Northern Front: 1800-1750
2022's Low: 1779 (28 January)
On Maneuvers: 1750-1579
The Floor: 1579-1466
Le Sous-sol: Sub-1466
The Support Shelf: 1454-1434
Base Camp: 1377
The 1360s Double-Top: 1369 in Apr '18 preceded by 1362 in Sep '17
Neverland: The Whiny 1290s
The Box: 1280-1240
To wrap for this week, we oft have fun with the foibles of the FinMedia, both analytically and certainly with respect to accuracy. Regular readers may recall our referring multiple times during 2019 to the writers' pool at the once mighty Barron's as now being populated by children. And without further ado, here we go again, thank you Dow Jones Newswires; (make sure you've swallowed that which you're drinking, lest you spew it whilst laughing): "Economists have sharply raised the probability of a recession, now putting it at a level usually seen only on the brink of or during recessions."
Seriously. Now get serious and grab some Gold!
Cheers!
...m...
www.deMeadville.com
www.TheGoldUpdate.com
********

Mark Mead Baillie has had an extensive business career beginning in banking and financial services for two years with Banque Nationale de Paris to corporate research for three years at Barclays Bank and then for six years as an analyst and corporate lender with Société Générale.
For the last 22 years he has expanded his financial expertise by creating his own financial services company, de Meadville International, which comprehensively follows his BEGOS complex of markets (Bond/Euro/Gold/Oil/S&P) and the trading of the futures therein. He is recognized within the financial community of demonstrating creative technical skills that surpass industry standards toward making highly informed market assessments and his work is featured in Merrill Lynch Wealth Management client presentations. He has adapted such skills into becoming the popular author each week of the prolific “The Gold Update” and is known in the financial website community as “mmb” and “deMeadville”.
Mr. Baillie holds a BS in Business from the University of Southern California and an MBA in Finance from Golden Gate University.
More from Gold-Eagle


