Gold Stocks’ New Short-Term Lows Can Only Mean One Thing


If not for the war, there would’ve probably been a repeat of the 2008 gold market. However, there is something similar: the bearish outlook for miners.
Gold stocks are declining similarly to how they did in 2008.
History Can Be Rhymed
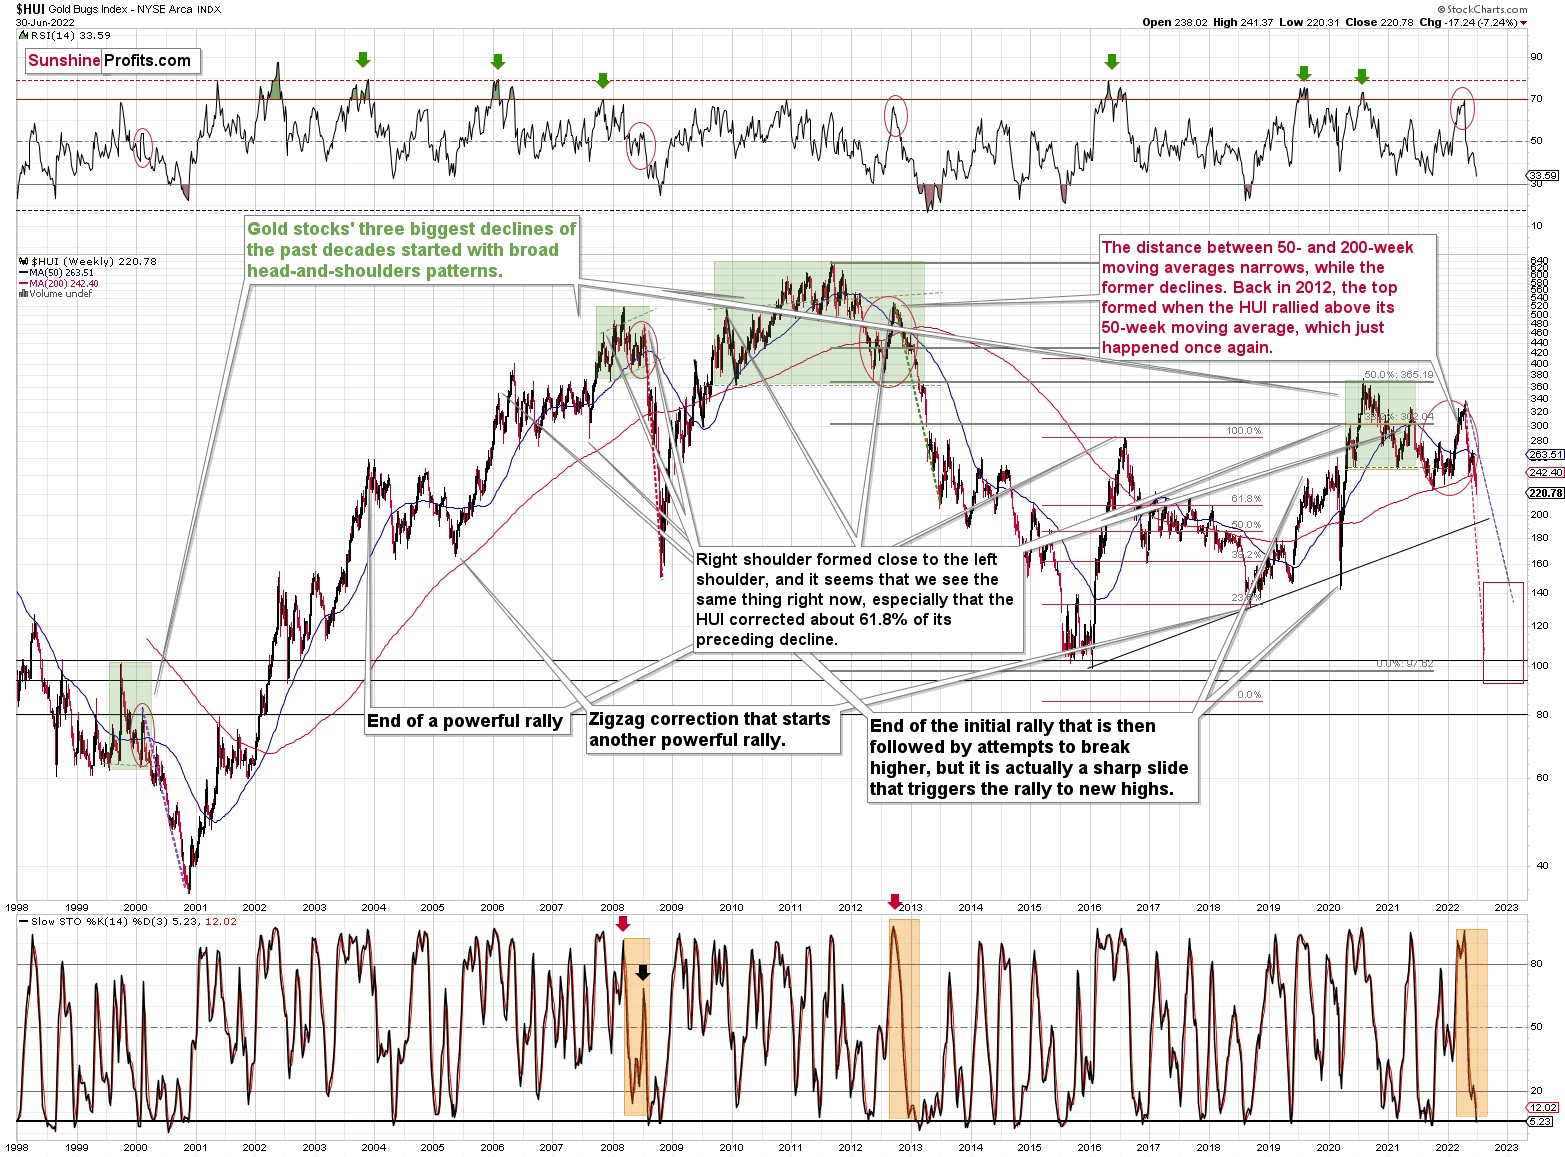
The Russian invasion triggered a rally, which was already more than erased, and if it wasn’t for it, the self-similarity would be very clear (note the head-and-shoulders patterns marked with green). Since the latter happened, it’s not as clear, but it seems that it’s still present. At least that’s what the pace of the current decline suggests.
I used a red dashed line to represent the 2008 decline, and I copied it to the current situation. They are very similar. We even saw a corrective upswing from more or less the 200-week moving average (red line), just like what happened in 2008.
We saw a breakdown to new short-term lows, which means that the volatile part of the slide is likely already underway.
Today’s decline in silver prices to new yearly lows definitely supports the above.
All right, let’s zoom in and see how mining stocks declined in 2008.
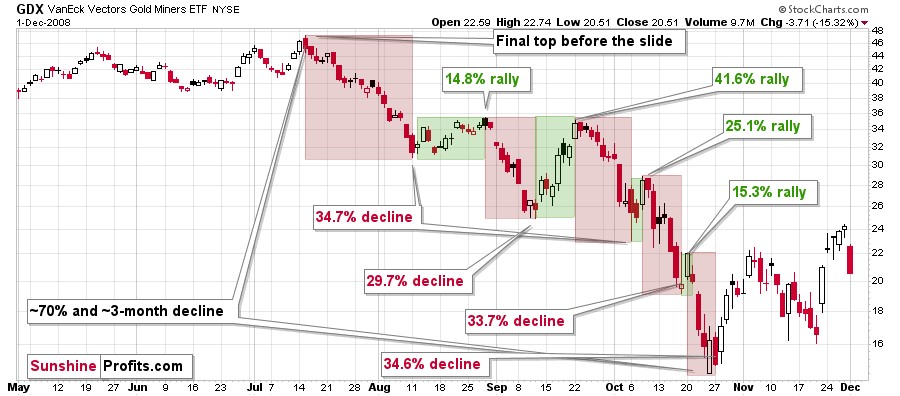
Back then, the GDXJ ETF was not yet trading, so I’m using the GDX ETF as a short-term proxy here.
The decline took about 3 months, and it erased about 70% of the miners’ value. The biggest part of the decline happened in the final month, though.
However, the really interesting thing about that decline – that might also be very useful this time – is that there were five very short-term declines that took the GDX about 30% lower.
I marked those declines with red rectangles. After that, a corrective upswing started. During those corrective upswings, the GDX rallied by 14.8-41.6%. The biggest corrective upswing (where GDX rallied by 41.6%) was triggered by a huge rally in gold, and since I don’t expect to see anything similar this year, it could be the case that this correction size is an outlier. Not paying attention to the outlier, we get corrections of between 14.8% and 25.1%.
The interesting thing was that each corrective upswing was shorter (faster) than the preceding one.
The first one took 12 trading days. The second one took seven trading days. The third one took 2 trading days, and the fourth and final one took just 1 trading day.
Fast forward to the current situation. Let’s take a look at the GDXJ ETF.
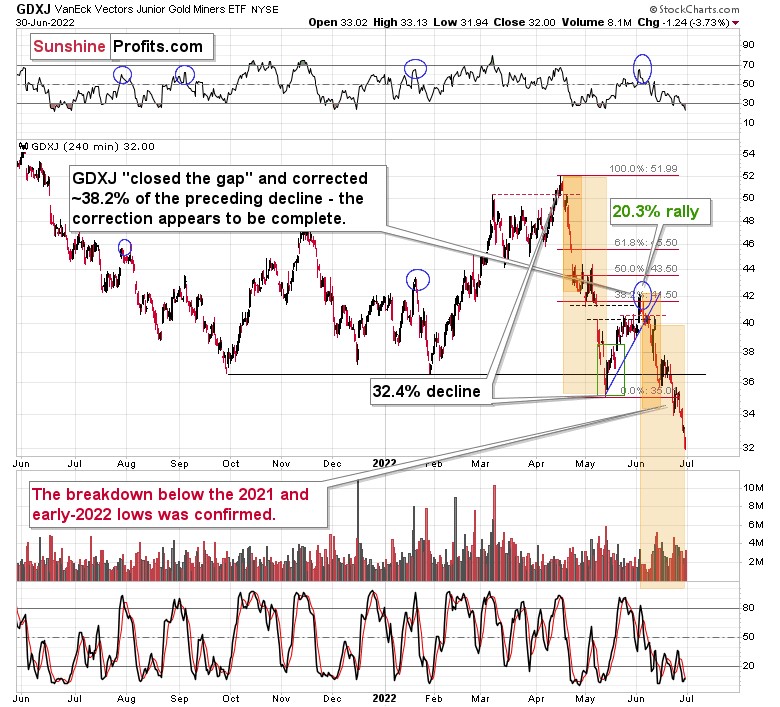
The GDXJ ETF declined by 32.4% and then corrected – it rallied by about 20.3%. The corrective upswing took 14 trading days.
The above is in perfect tune with the previous patterns seen in the GDX during the 2008 slide.
What does it tell us? It indicates that history can be rhymed, and while it will not be identical, we should pay attention to the indicators that worked in 2008. The next corrective upswing (a notable one, that is) might start when the GDXJ ETF declines by about 29-35% from its recent top. To clarify, I don’t claim that the above technique would be able to detect all corrective upswings, or that I aim to trade all of them. For instance, in my view, it was a good idea to enter a long position on May 12 and switch to a short position on May 26, but I wasn’t aiming to catch the intraday moves.
GDXJ could also decline a bit more than 29-35%, as let’s keep in mind that previous statistics are based on the GDX ETF and we are discussing the GDXJ here, and the latter is likely to decline even more than GDX as juniors are more correlated with the general stock market (and the latter is likely to slide).
So, let’s say that the GDXJ might decline between 29% and 40% from the recent high before triggering another notable corrective upswing (one that could take between 5 and 10 trading days based on how long the last one took and how big those corrections were in 2008).
The recent high was formed with the GDXJ ETF at $42.19. Applying the above-mentioned percentages to this price provides us with $24.78-29.32. And yes, the above would be likely to take place along with a big decline in gold prices.
Now, is there any meaningful support level in this area that could stop the decline?
Yes!
Still Bearish
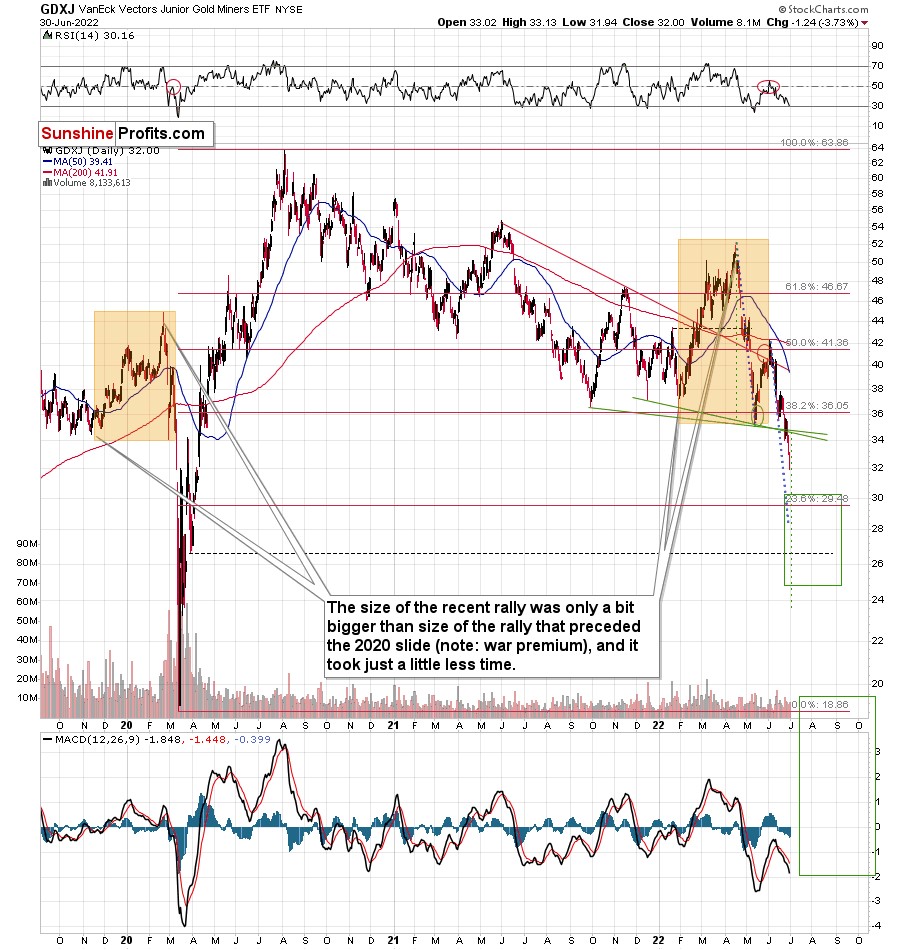
The late-March 2020 low is at $26.62, and it provides significant short-term support within the analogy-based target area.
Additionally, the above corresponds – more or less – to the size of the decline that would match the size of the April-May decline. It would be only somewhat bigger.
Let’s keep in mind that gold stocks don’t necessarily move on their own, but rather move along with gold. So, if gold moves to its strong medium-term support provided by the 2021 lows and then starts a brief rally, the same action would be likely in mining stocks.
The head and shoulders pattern confirms that the downside target is well below $30, perhaps even as low as ~$24.
There’s also an additional detail present on GDXJ’s very short-term chart.
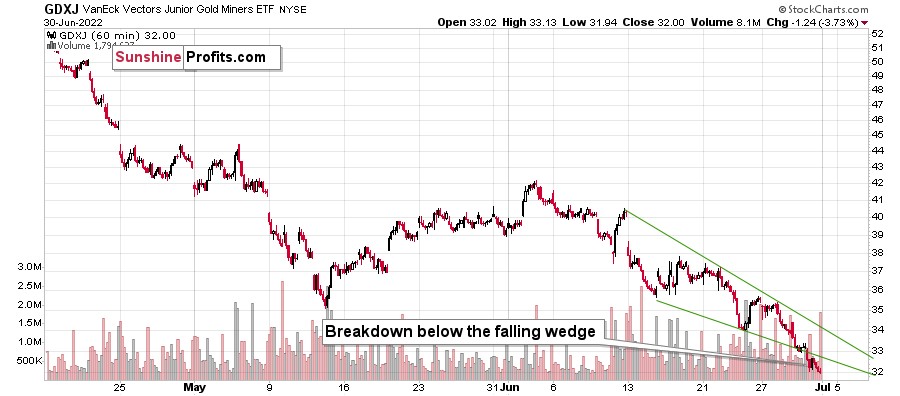
The GDXJ just broke below the declining wedge. While falling wedges are usually a bullish sign, they only become such after a break to the upside. What we witnessed was a relatively uncommon occurrence: a breakdown on the downside. The implications are therefore bearish instead of being bullish, and the profit potential for the current short position remains enormous.
Thank you for reading our free analysis today. Please note that the above is just a small fraction of today’s all-encompassing Gold & Silver Trading Alert. The latter includes multiple premium details such as the targets for gold and mining stocks that could be reached in the next few weeks. If you’d like to read those premium details, we have good news for you. As soon as you sign up for our free gold newsletter, you’ll get a free 7-day no-obligation trial access to our premium Gold & Silver Trading Alerts. It’s really free – sign up today.
Przemyslaw Radomski, CFA
Founder, Editor-in-chief
Sunshine Profits: Effective Investment through Diligence & Care
* * * * *
All essays, research and information found above represent analyses and opinions of Przemyslaw Radomski, CFA and Sunshine Profits' associates only. As such, it may prove wrong and be subject to change without notice. Opinions and analyses are based on data available to authors of respective essays at the time of writing. Although the information provided above is based on careful research and sources that are deemed to be accurate, Przemyslaw Radomski, CFA and his associates do not guarantee the accuracy or thoroughness of the data or information reported. The opinions published above are neither an offer nor a recommendation to purchase or sell any securities. Mr. Radomski is not a Registered Securities Advisor. By reading Przemyslaw Radomski's, CFA reports you fully agree that he will not be held responsible or liable for any decisions you make regarding any information provided in these reports. Investing, trading and speculation in any financial markets may involve high risk of loss. Przemyslaw Radomski, CFA, Sunshine Profits' employees and affiliates as well as members of their families may have a short or long position in any securities, including those mentioned in any of the reports or essays, and may make additional purchases and/or sales of those securities without notice.
********
 Przemyslaw Radomski, CFA, is the founder, owner and the main editor of SunshineProfits.com. You can reach Przemyslaw at: http://www.sunshineprofits.com/help/contact-us/.


