Gold Stocks Are Following This Historical Template


Roughly one year ago and prior to that we observed that the gold stocks could be following the recovery template from what we deemed a “mega bear market.”
We define that as a bear market that is over two and a half years in time and over 80% in price. It cuts both ways.
The gold stocks from 2011 to January 2016 had declined more than 80% and for more than four years. It was a textbook mega bear market.
The sharp recovery in 2016 quickly faded and left us wondering if there was a historical comparison.
Turns out, there are three strong and relevant comparisons.
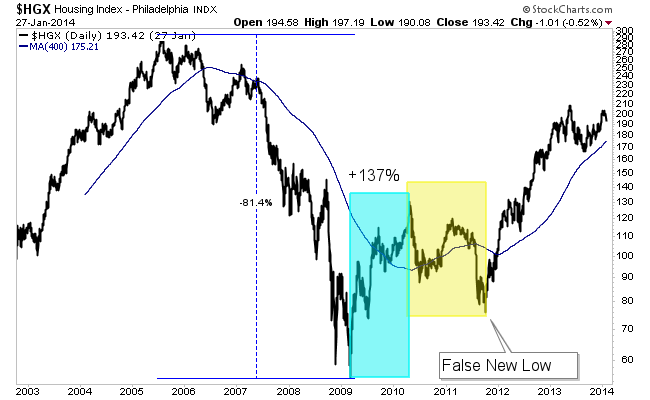
The housing sector declined 81% from its peak in 2005 to the market bottom in March 2009. Then it rebounded 137% before correcting 42% over 18 months. The correction ended with a false new low.
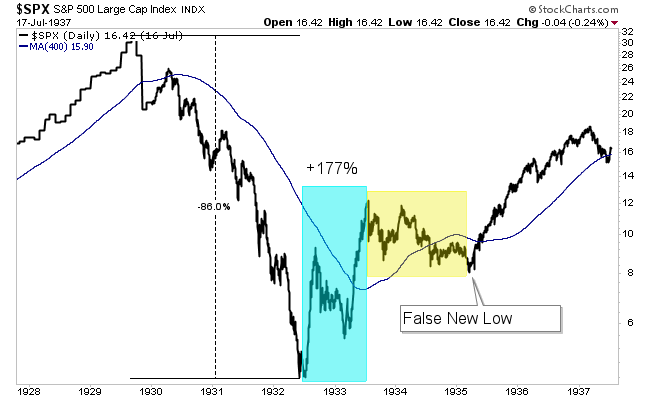
The S&P 500 crashed nearly 90% over a nearly three year period. Then it rebounded 177% before correcting for 20 months. That correction also ended in a false new low.
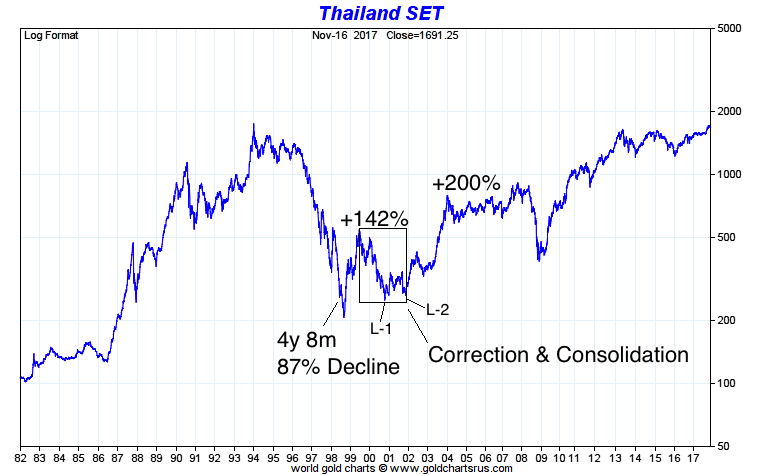
Thailand from 1994 through 2000 is quite similar to the gold stocks from 2011 through 2016. Before its 200% move higher from 2002 through 2003, Thailand corrected 54% over a 2-year and 5-month period.
Note that its final low at the end of 2001 could have been a false new low if not for the initial sharp correction down to L1.
The template for a recovery from a mega bear market is as follows.
Following the bear market low, a sharp rally begins that lasts only six to twelve months. Then the market endures a significant correction that lasts a minimum of 18 months and ends with a breakdown to new lows (which ends up being a false move).
Then the major wave higher begins.
Here is the data on those three examples, another one (Mortgage sector) and the gold stocks (GDX).
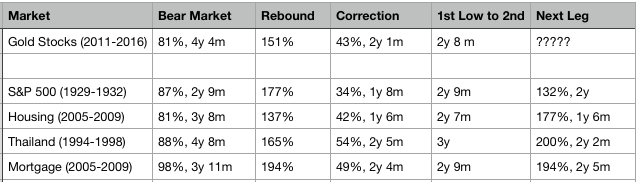
Note how the time between the bear market bottom and the correction low (for the gold stocks) is almost identical to three of the four examples. Also, note how the second leg higher surpassed the initial rebound in each example (ex S&P 500).
Here is how GDX stacks up (visually) with the others. Its rebound (and potentially second leg higher) began after the false breakdown in September.

Last week we asked the question whether gold stocks would correct or consolidate in a bullish fashion. The evidence now favors a bullish consolidation. As a result, we are looking at potential near-term upside targets of $1350-$1360 for Gold, $25 for GDX and $37 for GDXJ.
The short-term trend is healthy and this historical comparison is table-pounding bullish. We’ve been increasing our exposure and will continue to do so. Plenty of great values remain and there is time to position yourself to take advantage. To learn what stocks we are buying and think have 3x to 5x potential consider learning more about our premium service.

Jordan Roy-Byrne, CMT is a Chartered Market Technician and member of the Market Technicians Association. He is the publisher and editor of TheDailyGold Premium, a publication which emphasizes market timing and stock selection, as well as TheDailyGold Global, an add-on service for subscribers which covers global capital markets. He is also the author of the 2015 book, The Coming Renewal of Gold’s Secular Bull Market which is available for free. TheDailyGold.com was recently named one of the top 50 Investment Blogs by DailyReckoning and WalletHub.


