Gold Trips On Its Technicals; How Low Does It Go?


'Twas four weeks and forever ago (gold then at 1256) when our technical awareness first perked up for gold to move down, Silver then primed to start slipping as copper was already letting go. But per the above panel if you count back four gold dots (weeks), you'll see that price instead stayed buoyed, having since reached as high as 1297. Fundamental credit due with tips of the cap to a big ole bomb, a Le Pen and a Macron, and a rather threatening person named "un". But now, gold's come all undone, having skidded as much as 71 points (-5.5%) in just the last 15 trading days.
Moreover as we saw a week ago at first trimester's end, gold was up the most (+10.2%) in 2017 within our BEGOS Markets (Bond, Euro/Swiss, Gold/Silver/Copper, Oil, S&P 500). But in settling out the week yesterday (Friday) at 1228, gold year-to-date is now but +6.6%, it and silver (+2.4%) being passed up into first place by -- can you believe it -- the now record high S&P (+7.2%)! "Yippee!"
And as for any Dollar weakness of late keeping gold aloft, "Fawgit about it!" as here we have their respective percentage price tracks for the past 21 trading days, both down some 2% from a month ago:
So with fundamental logic having been cast aside, in the offing gold's technical tools finally paid their downside dues, our infamous "Baby Blues" (as you'll herein see) bollocking lower, the daily Price Oscillator (as we've been noting of late in our daily commentary) crossing to negative, and now the cherry on top being the big red parabolic dot heralding the weekly trend's having flipped from Long to Short as we next here see across a year's-worth of bars. Note that it took a full month for gold to climb up through the purple-bounded 1240-1280 resistance zone, only to fall back down through it all in basically this past one week:
'Course, gold's weakest period in the week was the 10-point drop during the two hours following the Federal Open Market Committee's "no-go" policy statement on Wednesday. Do you read the FOMC's actual policy statements? We do: 'tis far better than being told what it said, let alone it being exacerbated by the spin we're then fed 'bout the Fed. And this time 'round what we read was that essentially everything's fine, yet that all members' votes to move were benign. Here's how the Economic Barometer reads it:
Speaking of stocks, the S&P closed out the week as noted at a record high (2399). But as upon which we oft harp -- from the "If You Don't Believe It, Do The Math Dept." -- our "live" price/earnings ratio for the S&P at 34.0x remains well beyond its engine's "redline", which if maintained leads to comprehensive expiration; (recall from your basic B-school portfolio course that 5x is under-valued, 10x is fairly-valued, and 15x is over-valued); but yeah-yeah, that's just old school ... until we get back down there again as was the case in March 2009 (13.8x). At least the good news for the paradigm-shift-believer crowd apparently is that history shan't repeat itself.
"But wouldn't that mean gold won't ever again make an all-time high, mmb?"
Ah, Squire, back from your annual tour of the Amsteg facility, I see. Not to worry, gold shall exceed its 06 September 2011 All-Time High of 1923 once the arguably 95% folks who don't own any decide to so do. Remember: the price of gold can rise quite swiftly upon the banks and hedgies backing in the truck to load up. We need only recall the "Black Swan" in 2008 wherein gold, after having achieved 1000 for the first time ever, then got bound up 'mongst the panic, declining to as low as 681 ... only to then find itself three years hence +182%:
Repeat that performance today, and on a points basis: the present 1228 + 1242 = 2470, which is not that far from our current "Gold Scoreboard" Dollar debasement valuation of 2683. Or if instead on a like 182% increase: (1228 x 1.82) + 1228 = 3463, (Black Swan Part Deux, or otherwise). Either way, we'll be quite content with just 2000.
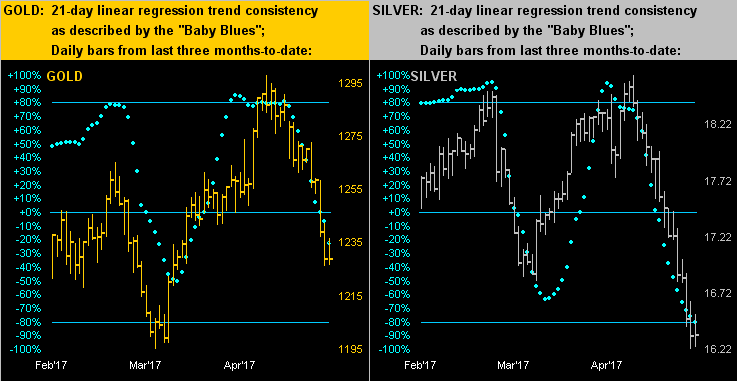
As for "the now", do you like the steep stuff? Such as the waves off Portugal's Praia da Nazaré? Or Chute 75° atop Squaw Valley's KT-22? Then check out these daily bar charts for both gold on the left and Silver on the right over the past three months. In both cases we see the aforementioned "Baby Blues" of 21-day linear regression trend consistency having gone absolutely over the falls: "Cowabunga!"
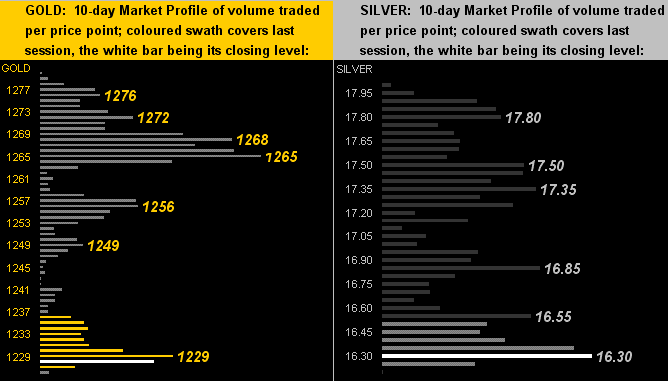
And in the wake of it all remains the bevy of trading resistors for gold (below left) and silver (below right), both for the second consecutive week being buried at the bottom of their 10-day Market Profiles:
Well-buried, as well, is Gold with respect to its spot in the stack:
The Gold Stack
Gold's Value per Dollar Debasement, (from our opening "Scoreboard"): 2683
Gold’s All-Time High: 1923 (06 September 2011)
The Gateway to 2000: 1900+
Gold’s All-Time Closing High: 1900 (22 August 2011)
The Final Frontier: 1800-1900
The Northern Front: 1750-1800
On Maneuvers: 1579-1750
The Floor: 1466-1579
Le Sous-sol: Sub-1466
Base Camp: 1377
2017's High: 1297 (17 April)
The Weekly Parabolic Price to flip Long: 1297
Neverland: The Whiny 1290s
The 300-Day Moving Average: 1259 and rising (barely)
10-Session “volume-weighted” average price magnet: 1257
Resistance Zone: 1240-1280
Trading Resistance: 1229 / 1249 / 1256 / 1265 / 1268 / 1272 / 1276
Gold Currently: 1228, (expected daily trading range ["EDTR"]: 13 points)
Trading Support: (none per the 10-day Market Profile)
10-Session directional range: down to 1226 (from 1297) = -71 points or -5% -- 2017's Low: 1147 (03 January)
So how low does Gold go on this down leg? For that let's tune in an episode from "The Art of the Fib". Regular readers know that we're not that enamoured with employing Leonardo Bonacci's numerical sequence which spirals the Golden Ratio (62%) into infinity after just a few divisional iterations. To be sure, the ratio is science as 'tis mathematically derived. But we regular quip that there's an art from where one positions it all toward then making one's postulations. That said, when you get it right, it works with startling accuracy. Specific to this case for gold: if we measure from its StateSide post-election low of 1124 (15 December) to this year's high of 1297 (17 April), an initial 38% retracement (i.e. the remainder being the 62% Golden Ratio) brings us to 1231, just about where Gold presently is (1228). Or rather should we get the ever-popular FinMedia 50% retracement, we're looking at 1211. If instead Gold achieves the full 62% Golden Ratio retracement, we'll see 1190. Whichever way, as they say, "Art is in the mind of the beholder." And indeed this one, as is Gold, is timeless!

Mark Mead Baillie has had an extensive business career beginning in banking and financial services for two years with Banque Nationale de Paris to corporate research for three years at Barclays Bank and then for six years as an analyst and corporate lender with Société Générale.
For the last 22 years he has expanded his financial expertise by creating his own financial services company, de Meadville International, which comprehensively follows his BEGOS complex of markets (Bond/Euro/Gold/Oil/S&P) and the trading of the futures therein. He is recognized within the financial community of demonstrating creative technical skills that surpass industry standards toward making highly informed market assessments and his work is featured in Merrill Lynch Wealth Management client presentations. He has adapted such skills into becoming the popular author each week of the prolific “The Gold Update” and is known in the financial website community as “mmb” and “deMeadville”.
Mr. Baillie holds a BS in Business from the University of Southern California and an MBA in Finance from Golden Gate University.
More from Gold-Eagle


