Gold (Unloved) Yet To Get The Cash; S&P (Adored) Yet To Get The Crash


Never was anything of such high intrinsic value so unloved: Gold.
Never was anything of such low earnings output so adored: the S&P 500.
And as you regular readers well know, the current market levels of Gold (1783) and the S&P (4442) ought justifiably be swapped: for 'twould approximate quite well their "true" value today.
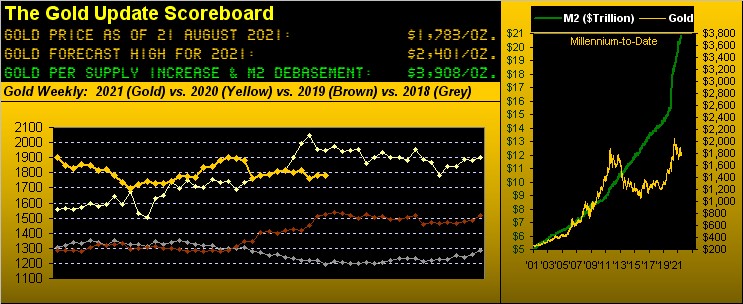
But even with the S&P beginning to show cracks in its otherwise relentless upside glide, Gold yesterday (Friday) closed out its narrowest trading week in over a year (since that ending 14 February 2020) at the unloved 1783 level. Yes, that's the very same 1783 level which Gold first achieved a decade ago on 09 August 2011 when the U.S. money supply (by "M2") was $9.46 trillion, just 45.4% of today's $20.86 trillion fauxnomenon. Further with no respect to value -- and the market never being wrong -- on goes Gold's otherwise sleepy parabolic Short trend, now eight weeks in duration, per the declining red dots in this year-over-year view of the weekly bars:

The S&P however finished its week at the adored 4442 level, a mere 38 points below the all-time closing high of 4480 ... but not without having to "bear" (luv it) a mid-week scare. As penned back in our 31 July missive "An August August for Gold?" (and 'tis been hardly august at that): "...the Federal Open Market Committee ... know they're ... a catalyst for 'it all going wrong' the instant they jerk the rug a tad..." as they just so inferred via their 27/28 July Meeting Minutes for slowing the flow -- with just four months to go -- this year from the asset purchasing tap.
Perhaps just a wee jerk of the rug, but 'twas enough to put our "Baby Blues" of S&P 500 futures trend consistency into free-fall as we see here on the left by the daily bars for the past month, and as well flip the daily Parabolics dots from Long to Short on the right. Perhaps an early harbinger (should we have one this year) of "crash season" (Sep/Oct)?
"But mmb, this earnings season was obviously so much better than last year..."
Squire, how could earnings not have improved over those Covid-infused of Q2 a year ago? Indeed this year's Q2 was supposed to have been "The Big Quarter", right? "Well Bud, we're right in the earnings sweet spot post-Covid and Pre-Delta: it cannot get any better than this!"
At a high-level, let's briefly turn to our summary of Q2's Earnings Season (06 July - 20 August) for the S&P:
■ 454 of the 505 constituents reported within that calendar parameter;
■ 390 of the constituents reported positive earnings for Q2 in both 2020 and 2021;
■ The median earnings improvement for those 390 constituents was +35.4%.
Therefore, Squire, here's the problem: to bring the current "live" price/earnings ratio of 48.5x down to its lifetime (since 1957) median of 17.8x (per Bob's Shiller's "trailing 12 months" measure) -- which as you know always happens -- at least one of two things must occur:
■ Either the "E" (earnings) have to grow at nearly five times the +35.4% recorded for Q2, which never shall happen given Q2 this time 'round being a one-off hyper-growth gift compared to the shutdown effects of a year ago; and/or
■ The "P" (price) has to correct by -63.3%, which demonstratively can happen given those corrections exceeding -50% in both 2001-2002 and 2008-2009. "Get Ready..." --[The Temptations, '66].
And the dirty little secret continues to be that the "risk-less" yield on the U.S. T-Bond at 1.874% is 41.4% higher than the "risk-full" (understatement) yield on the S&P 500 at 1.325%. But that doesn't fit the modern-day market mania whereby you need to sound cool at the barbeque because you own shares of Tesla (a four-wheel battery company with a current P/E of 304.6x instead of boring old Ford's 14.3x or General Motors 5.6x).
The stock market crash really is coming; we just don't know when: first "they" must play the game of who or what to blame. And yet here we've Gold today at 1783 trading at but 45.6% of its dollar-debased value of 3908. The choice is obvious: "Got Gold?"
Now let's see what we've "got" for the economy recently deemed so "hot". After all, Boston FedPrez Eric "Rosy" Rosengren in the words of The Wall Street Journal "sees strong growth ahead for U.S. Economy" for which here is our Barometer:
To be sure, improved metrics this past week were posted for July's Leading Indicators, Industrial Production, Capacity Utilization and Permits for building new Houses.
But too, there was the dark side: August's New York State Empire Index, Philly Fed Index, and National Association of Home Builders Index all dropped substantially; July's Retail Sales actually shrank; and June's Business Inventories bloated. Sung to the tune of Henry Mancini's iconic 'Moon River': "StaaaaagFlation, wider than a mile..." , itself right in tune with Dow Jones Newswires reporting this past week that "The Covid-19 variant is damping consumer demand and raising costs for business after a spring and summer that seemed to promise a rapid recovery." (Has the S&P crashed yet?)
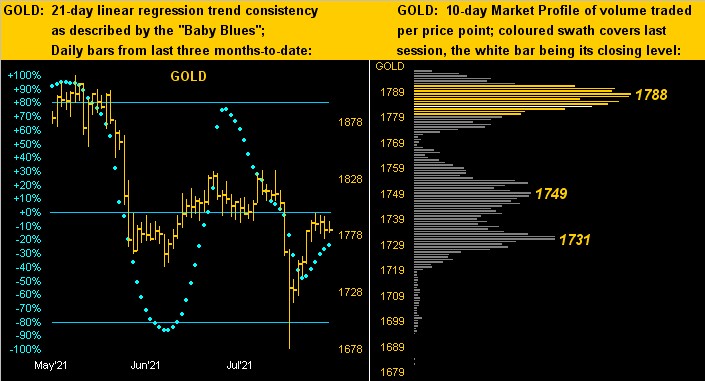
Stabilizing from its own micro-crash in the prior week is our Gold, as noted just having recorded its narrowest trading week in a year-and-a-half. Hence the most recent price bunching in the three-months daily bars chart (below left). Then in Gold's 10-day Market Profile (below right) we see the dominant-volume traded prices as denoted:
But with the same graphical set for Silver: ouch! Indeed as economically-leading industrial metal Copper comes unglued (hint-hint, nudge-nudge, elbow-elbow), Sister Silver can't escape her gloomy mood (left), in turn creating quite the thicket of labeled overhead trading resistance (right):

And now for this week's CTQQ ("Closing Think Quick Quiz"): How many of the S&P's last 50 Septembers (1971-2020) have been down?
"Uhh, more than half of 'em, mmb?"
Very good, Squire: indeed 27 of them have been downers, and when significantly so, with finales well into October. Hence our definition of "crash season". 'Course, we've still two full trading weeks to go until this year's StateSide Labor Day (06 September), after which stocks in those down years further slid in earnest.
But you are prudently prepared, right? (...crick-crick ...crick-crick ...crick-crick...) To own the unloved? Or ride the adored? It again begs the question: Got Gold in your hoard?
www.deMeadville.com
www.TheGoldUpdate.com
********

Mark Mead Baillie has had an extensive business career beginning in banking and financial services for two years with Banque Nationale de Paris to corporate research for three years at Barclays Bank and then for six years as an analyst and corporate lender with Société Générale.
For the last 22 years he has expanded his financial expertise by creating his own financial services company, de Meadville International, which comprehensively follows his BEGOS complex of markets (Bond/Euro/Gold/Oil/S&P) and the trading of the futures therein. He is recognized within the financial community of demonstrating creative technical skills that surpass industry standards toward making highly informed market assessments and his work is featured in Merrill Lynch Wealth Management client presentations. He has adapted such skills into becoming the popular author each week of the prolific “The Gold Update” and is known in the financial website community as “mmb” and “deMeadville”.
Mr. Baillie holds a BS in Business from the University of Southern California and an MBA in Finance from Golden Gate University.


