Gold US$5,000…Is it Possible? And When?


If we look at a graph of the ‘70s gold bull market (graph #1) and superimpose the typical bubble shape, we can clearly see that it closely fits the bubble model but stopping short of a Total Despair Phase. Those like me who lived through the euphoria of the ’70s and the capitulation of the ’90s, I am sure, will agree with the description of the gold market as a bubble. Looking at the graph below it doesn’t look like gold was in a Despair Phase but I remember well in the ‘90s statements by many in the financial industry that gold was a relic of the past, a useless metal and that its fundamental value was zero, predicting lower prices of about US$50 and some even zero. These statements are very characteristic of a major bottom.
Graph #1: Gold Bubble 1980

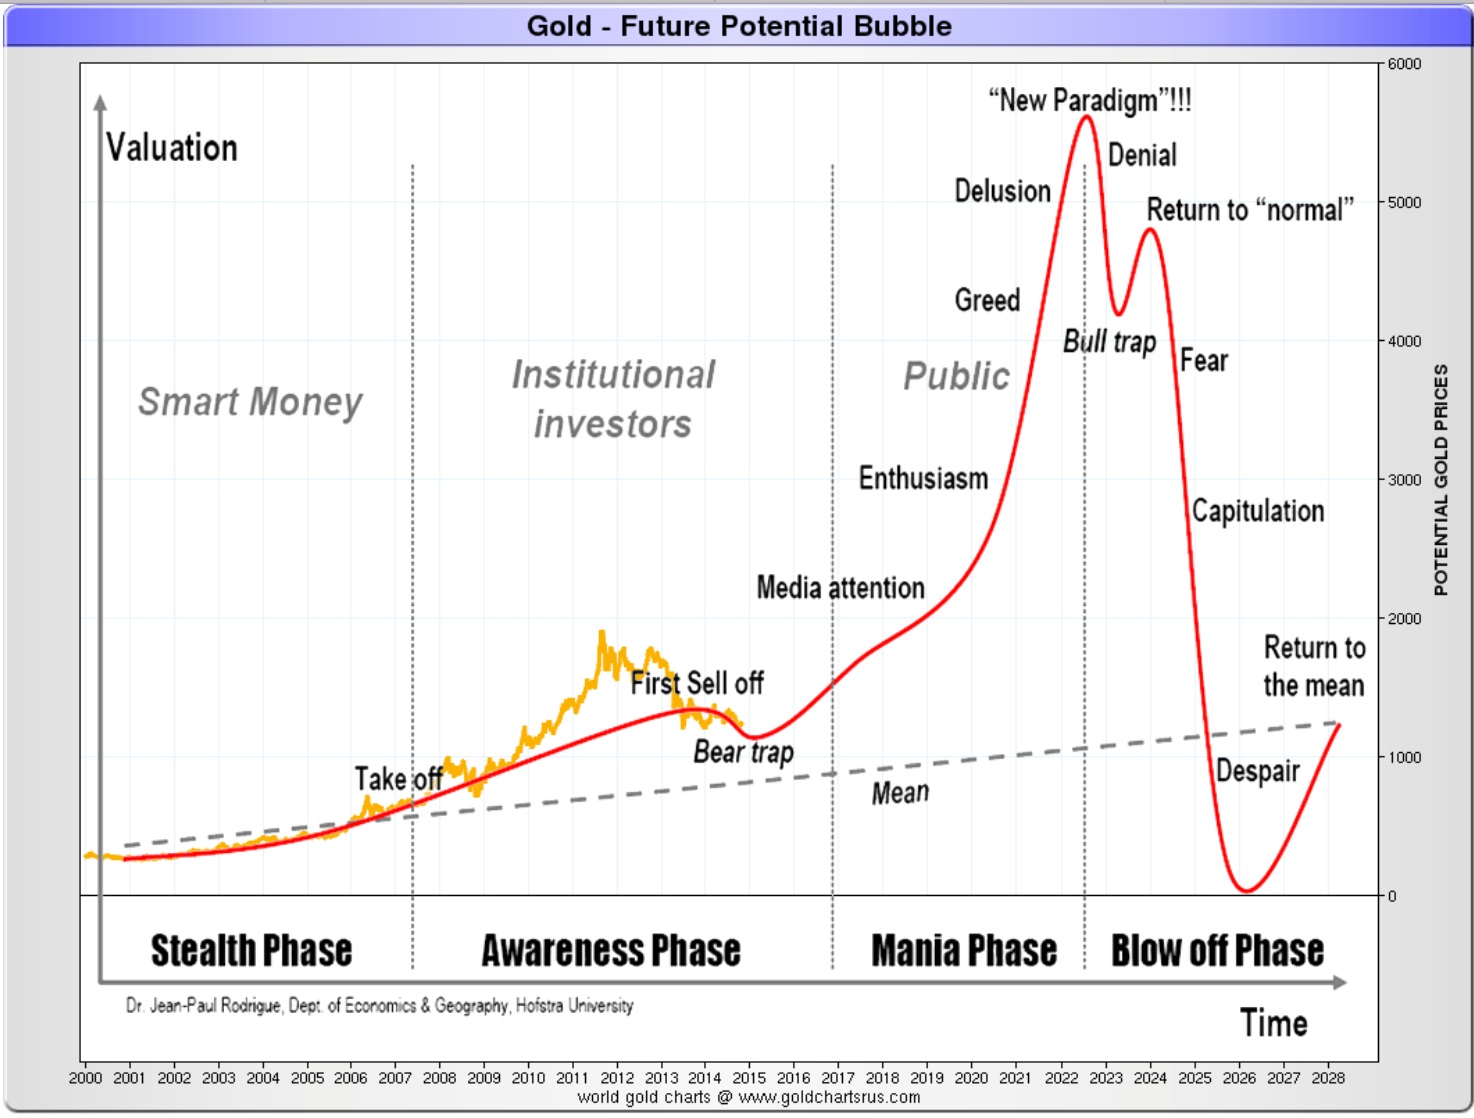
Now let us look at the present picture of the gold market since 2000 (graph #2) and compare it both to the ’70s bubble and to the typical bubble model. If, and this is a big if, history repeats, then gold is now in the Awareness Phase and, more specifically, at the end of a Bear Trap. If the gold price is to follow like in the ’70s the same pattern, or something close to it, then it looks not only possible that the price of gold will reach US$5,000, but even exceed it and approach the $6,000 level. As for when, if the ’70s’pattern repeats, even if not exactly in the same way, we could expect the Mania Phase to start somewhere between 2015 and 2017 and last until 2022-23.
Graph #2: Gold – Future Potential Bubble
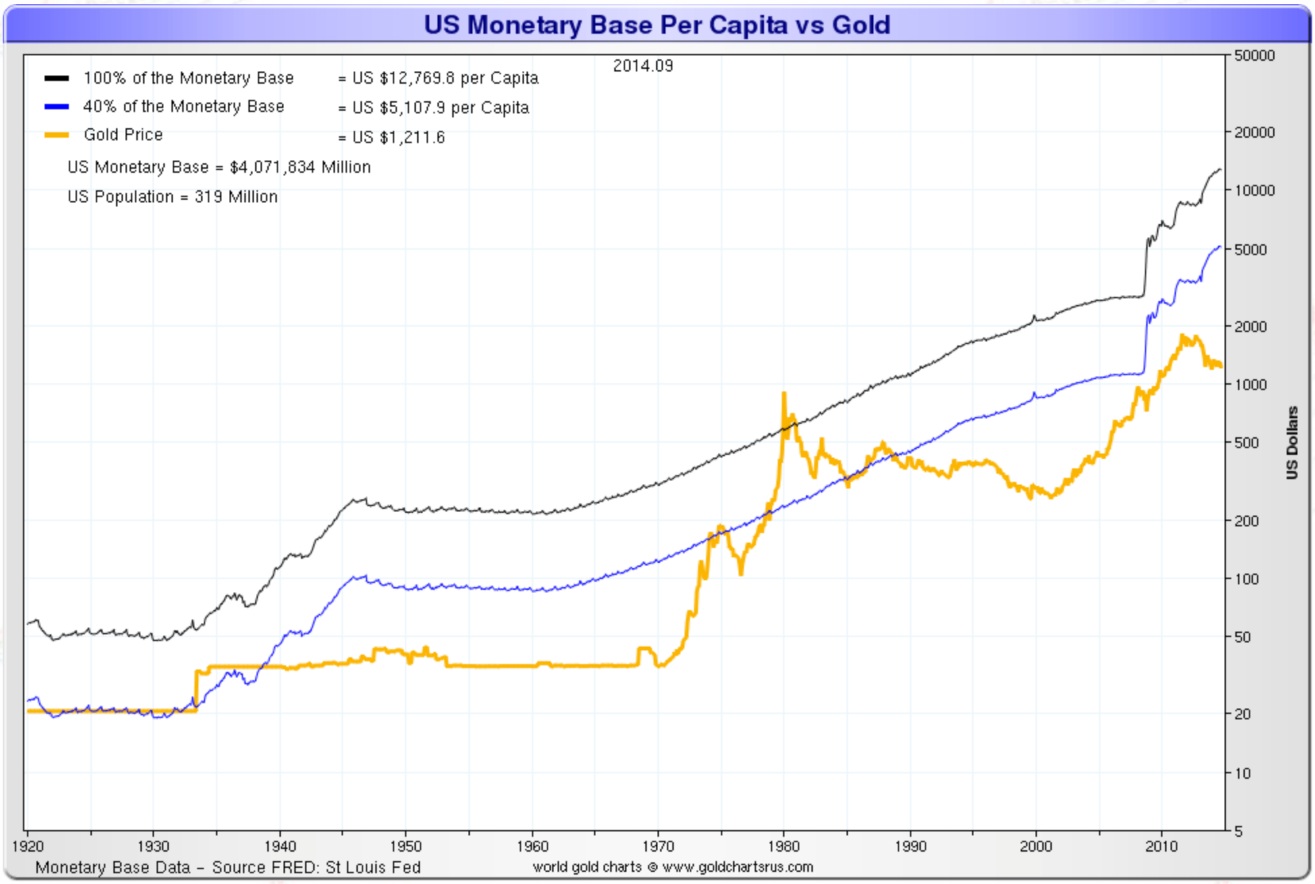
Remember also that gold is not an industrial metal but mostly a monetary metal. As such, if we compare it to the US monetary base as shown in the graph below (graph #3), at an assumed gold ratio of 40% of the monetary base, then the gold price should today be around US$5,000 while, at a ratio of 100%, it should be over US$10,000.
Graph #3: US Monetary Base Per Capita vs Gold
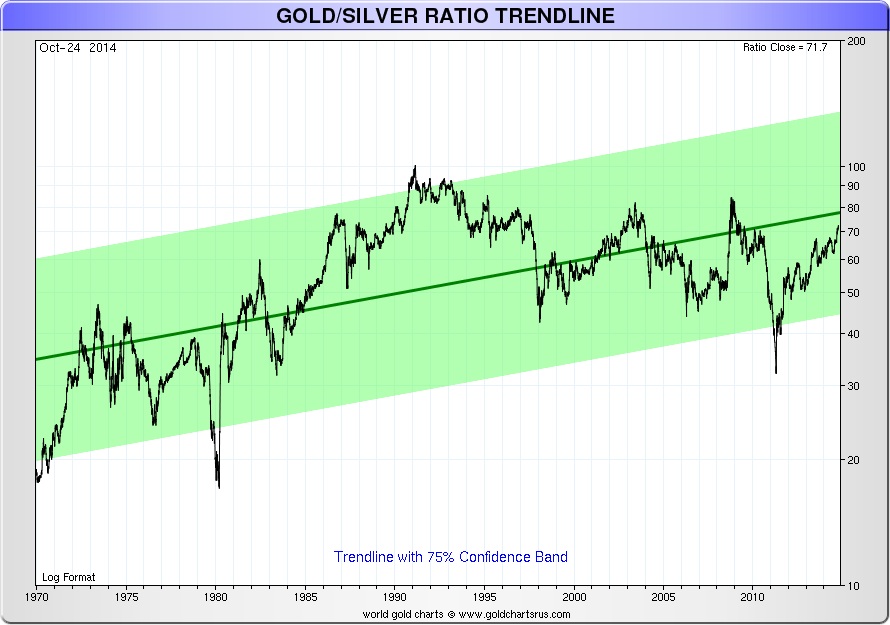
The very high Gold/Silver ratio (graph #4) also indicates to me an expectation by the precious metals market of a monetary collapse; gold being a monetary metal while silver today being mostly an industrial metal. The ratio can increase in the short term even more and reach at least 100. It is now 71.7. However, make no mistake, silver is a secondary monetary metal and correctly deserves, in my view, the nickname of “poor man’s gold”. Once the Mania Phase in gold starts, and I correlate it with the collapse of the present monetary system and, therefore, the US dollar, silver will follow gold and even outperform it. We have seen it in the recent Take Off Phase between 2000 and 2012.
Graph #4: Gold/Silver Ratio Trendline
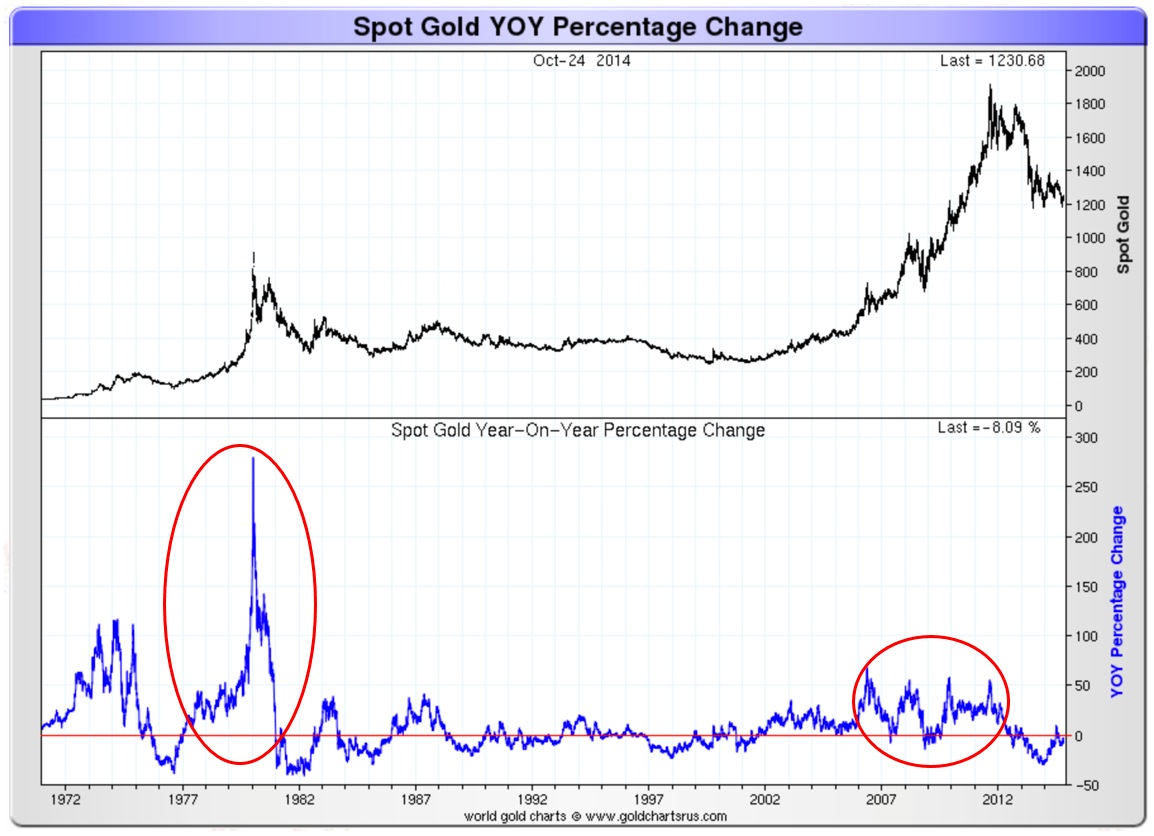
One indicator I like to follow in the gold market for signs of a Mania Phase is the 12-month price rate of change (graph #5). In plain English, it is the acceleration of price. Observe below the parabolic shape of this indicator in the ‘70s vs the recent flat shape since 2000.
Graph #5: Spot Gold Year-on-Year Percentage Change
The last few months gave the impression of an end of the financial crisis and a revival of the economy, especially the US economy, but as I said in a recent article, it was more like the calm before the storm. We are witnessing rather a shuffling of the financial problems on spread sheets with sophisticated financial engineering, which I think should be more correctly called financial shenanigans than engineering. The only thing that governments, but especially the US government, are trying to do is to push the problem into the future or send it offshore through currency wars.
The new Cold War is not going away either, but, on the contrary, it is intensifying. Geopolitical conflicts are starting everywhere from Ukraine in Europe, Somalia in Africa, Hong Kong in Asia, Venezuela in South America and Syria/Iraq in the Middle East and, not to forget the Ferguson riots in the U.S. Not even Canada is safe, as we have seen last week with the attack on the Canadian parliament. Some of those conflicts will remain local but some have the potential to escalate or provoke an open conflict between the super-powers.
So is gold US$5,000 a farfetched gold bug illusion, as some pretend? I do not think so. I’m looking for arguments against such an increase of the price of gold but I cannot find any reasonable ones. All I see is a deterioration and even more an acceleration of the deterioration of the global debt problem. It is evident that both Russia and China are accumulating gold for their official reserves and that gold is at the core of their currency wars and part of a strategy to dethrone the US dollar. The currency and gold wars are alive and even amplifying, ignoring the recent statements of the G10. Even the U.S. government desperately wants a devaluation of the dollar against gold, albeit a slow and controlled one. Will they get it? I doubt it. A collapse of the US dollar is not excluded, which can easily take gold to $10,000 and beyond. Some argue that without inflation or hyperinflation gold cannot reach $5,000, but they ignore that, in a deflationary environment, the global banking system collapses and this is as bullish for gold as hyperinflation.
Timing is the only thing that becomes the issue. Gold will reach at least US$5,000, but how soon? They say,“don’t fight the Fed”, and the recent past surely confirms this. However, it becomes evident that all the QEs did not restart the global economy; they only avoided a major collapse. All they have achieved is postponing the inevitable. If gold follows the typical bubble pattern, and I think it will, then gold will reach at least US$5,000 by 2022, which is within the next eight years. This remains speculation from my part but I think it is an educated guess based on history and my research. I still cannot ignore that we work with incomplete information and that gold is the most opaque market I know. I will adjust my projection as new information comes along if necessary. As John Maynard Keynes supposedly said, “When my information changes, I will alter my conclusions. What will you do, sir?” I’ll do just that.
********
Courtesy and Copyright by GoldBroker.com
Originally posted at https://www.goldbroker.com/news/gold-price-5000-dollars-possible-but-when-638

Gold & Silver Analyst / Member of the Goldbroker.com Editorial Team
Mr. Popescu is an independent investment analyst and studies the gold and silver market and their future role in the international monetary system. He has followed regularly since 1970 the gold, silver and foreign exchange markets. He has a bachelor degree in physics (1993) from Concordia University in Montreal, Canada and has completed the Canadian investment management certificate (1999) of the CSI. He is a member and was the president in 2004 of the CSTA and also was president in 2005 of the Montreal CFA Society. He is a member of the CFA Institute, the MTA, NYSSA, UKSIP, the CSTA and the Gold Standard Institute International.


