Gold On The Verge Of A Massive Move


Gold hasn’t had much success moving higher yesterday. Its breakout above the neckline of the previously completed head-and-shoulders pattern is close to being invalidated. Will that invalidation happen prior to or shortly after the Friday’s options expiry? In assessing the short-term outlook, we look at many factors, including the gold miners-to-gold ratio dynamics. Will they lead both metals on their upcoming move? In addition to explaining the above, in today’s analysis, we’ll feature our near-term downside targets for silver and mining stocks.
But first, a few words of introduction.
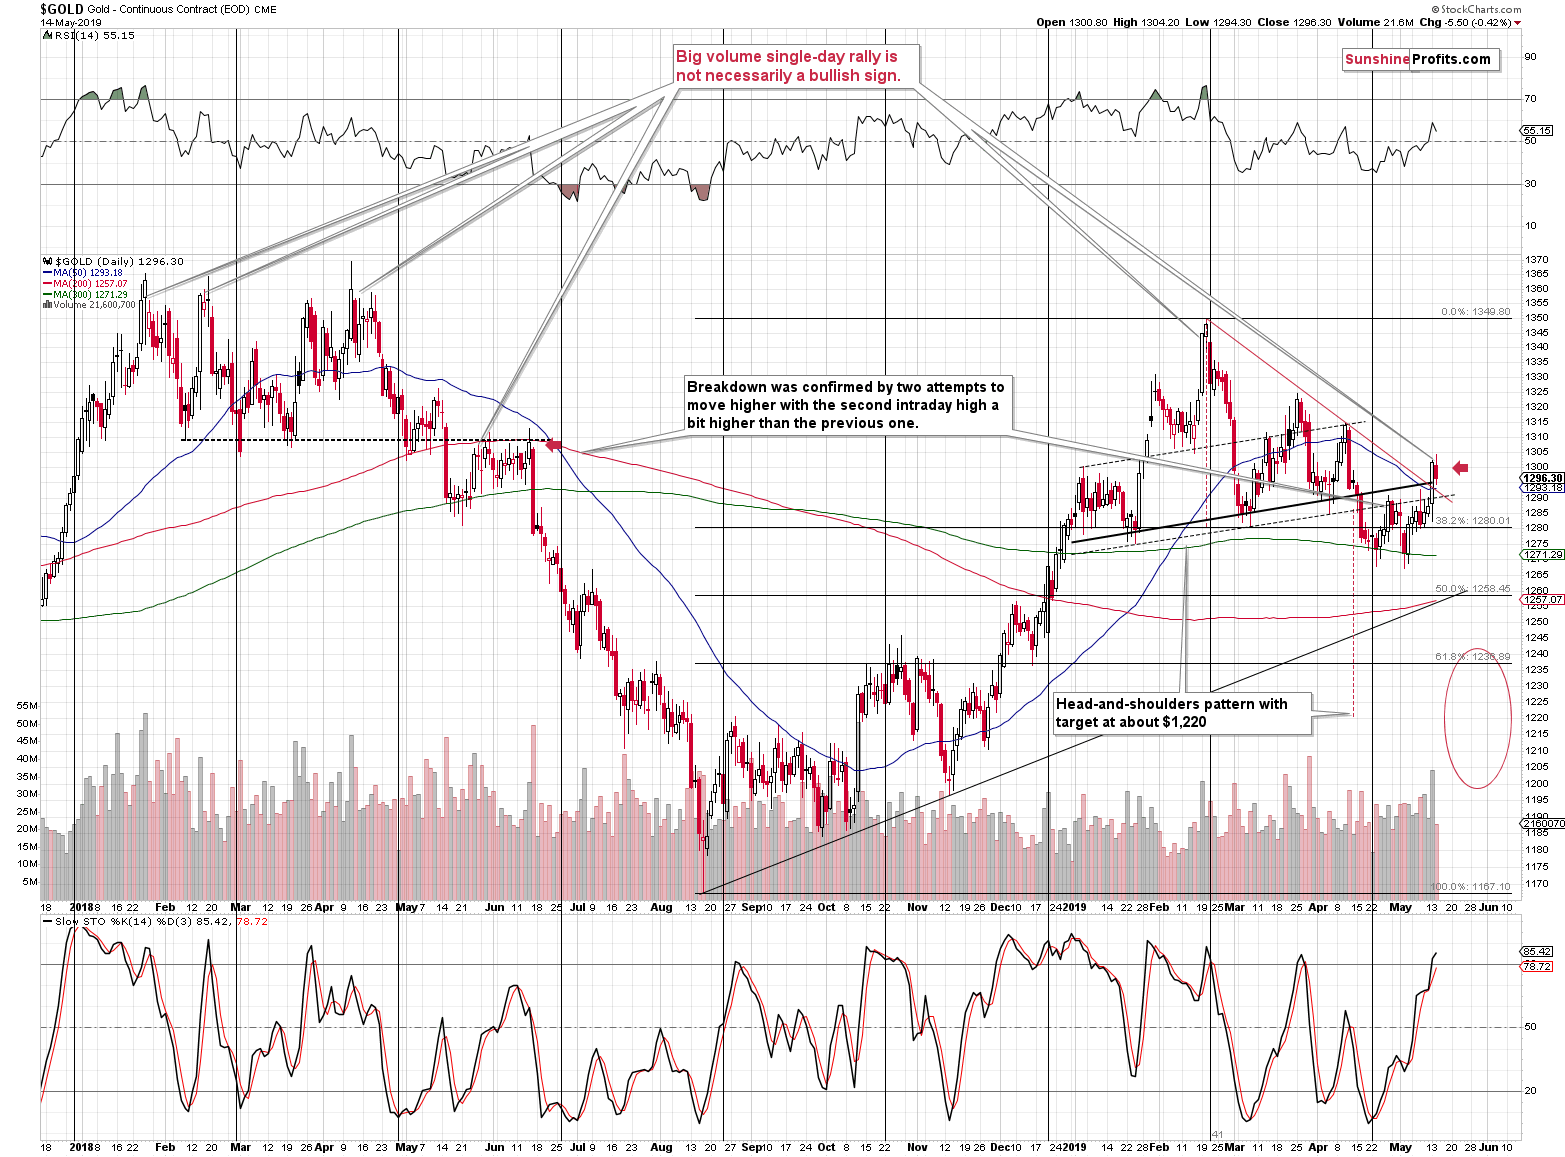
On Monday, gold soared on the possible escalation of trade wars. We have more than 2 weeks before the announced tariffs would come into effect, but since the markets are forward looking, they already discounted this in price. The general stock market fell, while gold and gold miners rallied sharply. Gold even managed to rally back above the neck level of the previously completed head-and-shoulders pattern. Moreover, gold moved above the declining resistance line based on the 2019 tops at the same time. The volume on which it all happened was huge – the biggest daily volume on which gold rallied so far this year. How bullish has the situation really become for the short run?
Barely. Yes, it might seem weird that such a combination of factors didn’t change much, but this is really the case. First of all, the only changes were of short-term nature. All the long- and medium-term factors continue to favor lower PMs prices in the following months. For instance, the gold to silver ratio rallied above 88 on Monday – well above the previous highs (including the 2008 highs). This is not a resistance being reached – it’s a confirmed breakout with profoundly bearish implications for the precious metals market in the following months.
Second, the technical changes are not as simple as stated above and we’ll get into the details in just a minute.
Third, it was a geopolitical event that triggered the move…and the effects of these moves tend to be temporary. It was not a purely technical move that would show market participants’ true attitude. Investors got scared and fled to the traditional hedge – gold. Gold was practically forced to rally regardless of what it’s about to do anyway. This means that Monday’s rally should be viewed with skepticism. The no-news-based breakdown in the mining stocks that we saw on Friday was many times more important as it showed where the market really wants to go.
Think about it this way – you hear jet engines and you look into the sky to check in which direction they are flying. If it’s very cloudy on that day and they are above the clouds, then you won’t be able to clearly determine it. You might hear something, but you won’t be sure, especially that the sound is delayed and there would be many airplanes in the air at the same time.
Gold was forced to rally on Monday, so its true intentions were obscured. We had some insights from the pre-market silver slide, but that’s it. Based on what we saw in the precious metals sector in the preceding days (based on what was on the horizon line before it got cloudy), we know that the overall outlook should be bearish. But still, it’s important to check how things developed on the charts, because just knowing the above is not enough to determine if gold and the rest of the PM sector is going to rally or decline in the next few weeks. Declines continue to be extremely likely in the next few months, but perhaps it’s a good time to exit the position and wait for a better moment to re-enter the market?
Searching for the right answers, let’s start with gold. Right then, we’ll follow up with silver.
Gold and Silver Are Treading Water
The yellow precious metal moved somewhat higher initially only to decline before the end of the session. There are two price levels that are important from the short-term point of view along with the reasons we expect gold to move back below them either this week or early in the next week.
Despite gold having moved higher and closing Monday’s session above the $1,300 level, gold’s continuous futures (that’s what the above chart represents) have turned lower yesterday, so this milestone was invalidated. However, in order to for the above chart to become fully bearish once again, gold should decline not only below $1,295 (the neck level of the head-and-shoulders pattern), but also below $1,293, which is the declining red resistance line that was broken on Monday. Price moves are usually confirmed within the next 2 days after the breakout or breakdown, so Tuesday and Wednesday closing prices are important. Will gold invalidate Monday’s rally by that time?
It seems quite likely and even if it doesn’t manage to do that by that time, it’s likely to head south within a week anyway. That’s particularly likely given the following two factors:
- The big-volume daily rallies were quite often seen at the final part of the rally and right before the turnaround. In fact, all major tops of 2018 and 2019 formed in this way. At times, there was one or two more (smaller) daily rally / rallies thereafter and at times, the slide followed right away but the overall tendency remained intact. Big-volume rallies in gold that we see after a calmer rally is not something very bullish as the technical-analysis-101 books would have one believe. Gold market reacts in its own way and what was saw yesterday looks like an indication of a top.
- We have a short-term triangle-vertex-based reversal just around the corner. The declining red resistance line crosses the neck level of the H&S pattern (black, dashed line) tomorrow.
Moreover, the last 2 times the Stochastic moved above the 80 level, we saw a local top shortly. One of them was the final top of the 2018-2019 upswing.
Let’s keep in mind that these are only the short-term factors pointing to lower prices. There are also multiple medium-term bearish confirmations that we are not discussing today, but that we have discussed in the previous days and weeks. For instance, the current decline is extremely similar to how gold, silver, and mining stocks (yes, all three) performed during the 2012-2013 slide.
Yesterday, gold closed a few dollars lower, but not yet below the above-mentioned price levels. The neck level of the head and shoulders pattern is still at $1,295, while the declining support/resistance line is now at $1,292. The latter is now a dollar lower, as is its, well, declining. Yesterday’s closing price was $1,296.30 and at the moment of writing these words, gold is trading at $1,295.70. Gold is therefore very close to invalidating the recent breakouts and starting another wave down.
The above-mentioned (in point 1) huge-volume rallies right before all major tops of 2018 and 2019 were followed by either an immediate decline (1 case), a daily pause (2 cases), and then a decline, or two days of pause and then a decline (1 case). Consequently, if this case is similar to the previous ones – and it seems that it is – we might see a decline right away, or we might see it tomorrow. Now, let’s keep in mind that options expire on Friday, so it will also be quite normal for the decline to be delayed until that time.
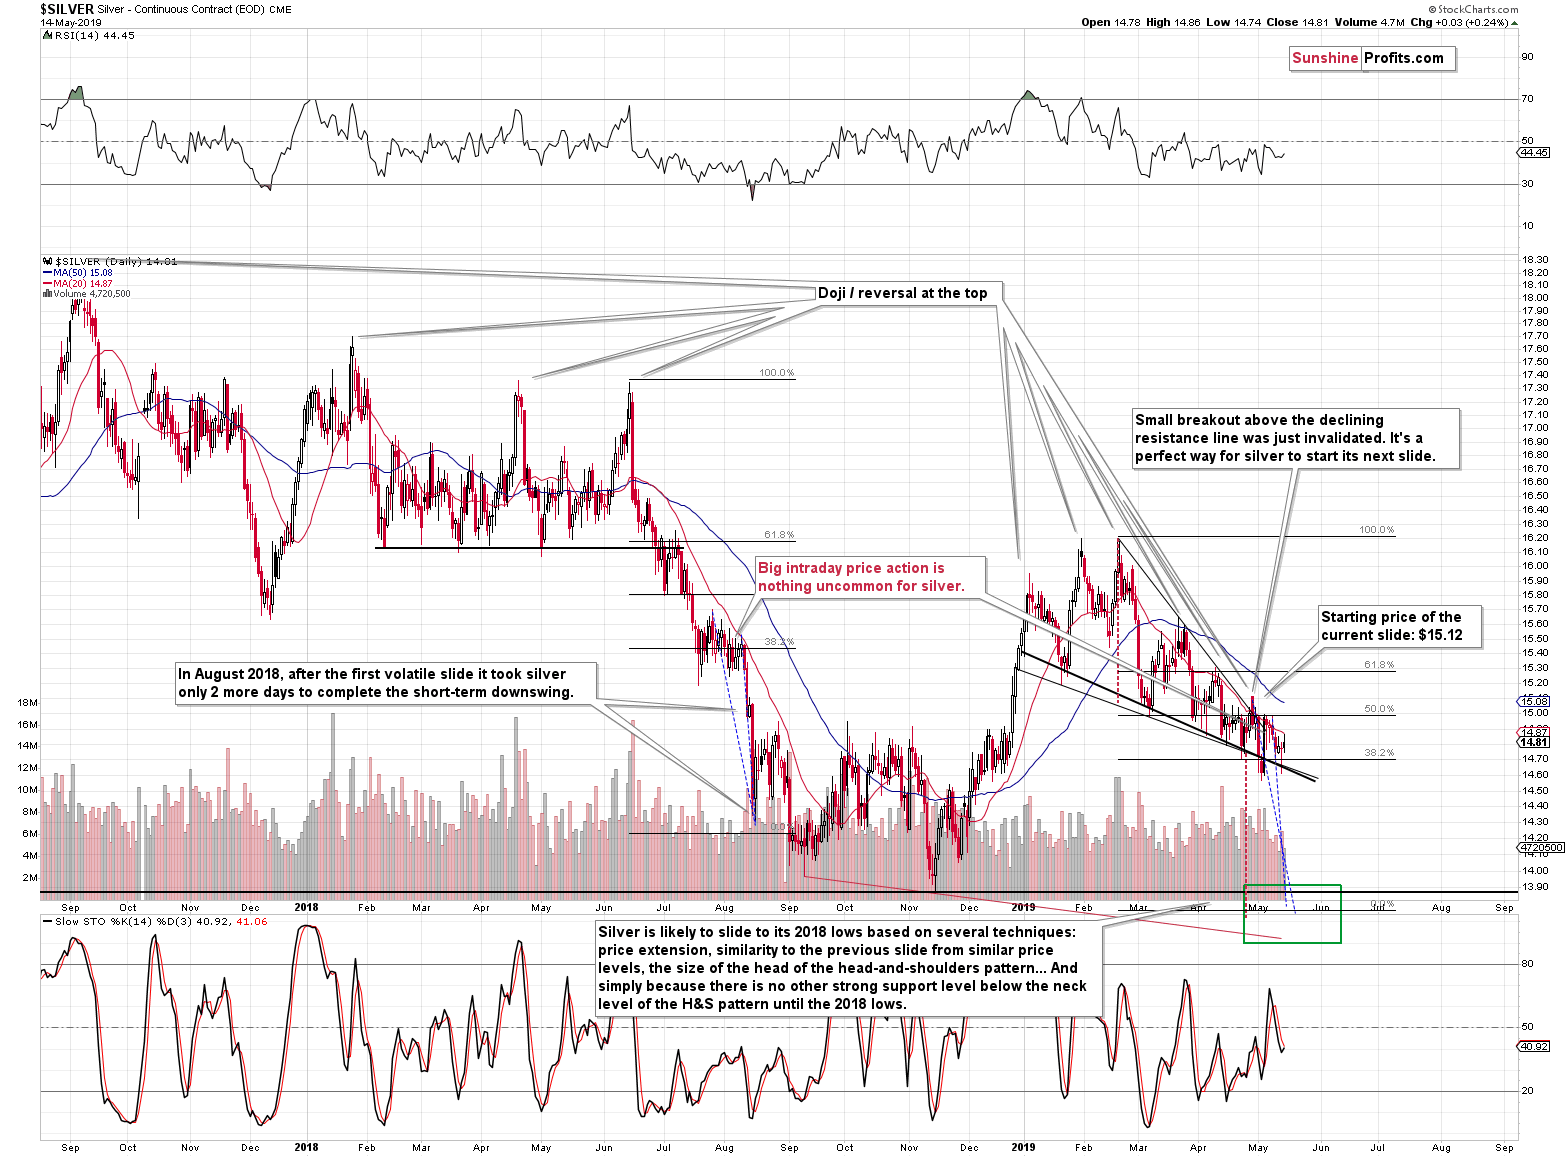
Silver hasn’t done much yesterday. It moved higher intraday but ended just 3 cents higher. It was almost a mirror image of what silver had done on Monday – it had moved lower first and then came back up.
Silver’s back and forth movement with lower highs makes the current moment very similar to what we saw in early August 2018. We wrote about it previously, but that was before a large part of the recent back-and-forth trading. The situation was similar previously, and it continues to be similar, but in a bit different way.
We have previously used the highest and final tops of the consolidation in order to measure the size of the following decline (blue dashed lines). We then applied these declines to the analogous recent tops. Now, because we saw more back-and-forth trading, we have new – and more appropriate – tops to “attach” those previous price moves to. By doing so, we get a more coherent target for the upcoming price slide than we have had before.
Previously, both declines pointed to the bottom between $13.90 and $14. Now, they suggest a move to about $13.75. This is very much in tune with the long-term support provided by the 2015 lows.
So, while it may be surprising, we have slightly more bearish and visibly more precise outlook for silver for the rest of the month.
Let’s move to mining stocks.
Watching Out For the Head and Shoulders in the Miners
Our comments on mining stocks are quite similar to the comments on gold. Let’s start by examining the GDX.
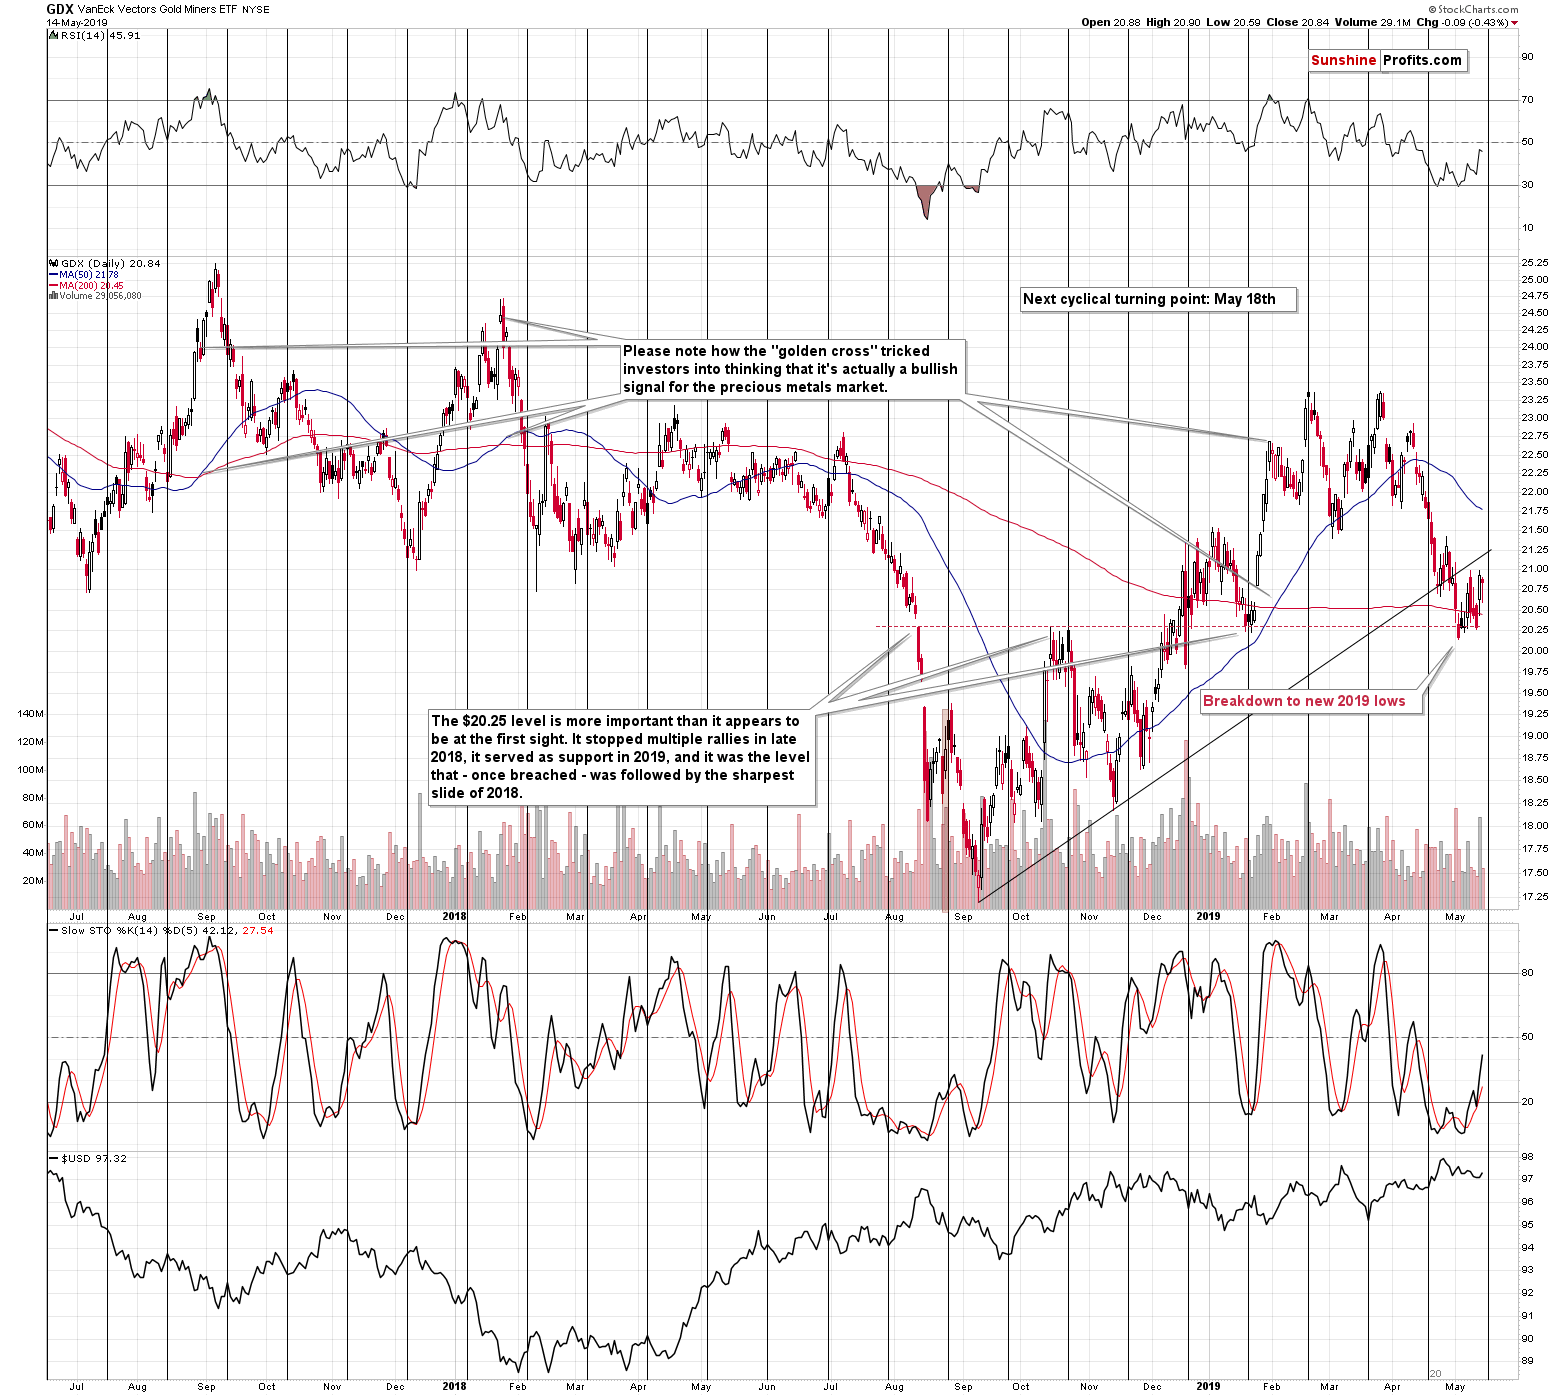
There is something very interesting on the GDX ETF chart. Namely, we saw a big-volume rally just ahead of the cyclical turning point. Does it look familiar? It should, because that’s exactly what we saw in the second half of February, earlier this year. That was the day before the final top of the year. So, is a big-volume rally necessarily a bullish thing here? No.
In our May 8 analysis, we wrote that if the miners strength wasn’t just a bluff, then the possible upside target (that would not change anything from the broader point of view) for the HUI Index was 162.5. To be clear, we wrote the following:
Gold stocks (…) might move to the late-April highs, the 38.2% Fibonacci retracement, or the early January highs, which would make the current upswing symmetrical to the early-January decline. As far as the latter is concerned, it might be likely (assuming that miners would move higher from here at all) as the miners have already proved to form such symmetrical patterns in the past. For instance, the early-November 2018 rally and top, was symmetrical to the early-October action. All the above points to approximately 162.5 as the possible upside target. "Possible" doesn't mean "likely", though.
There is one more thing that needs to be considered – the previously broken rising resistance line. It´s currently at about $21.25. Consequently, the analogous target for the GDX ETF, based on the above-mentioned symmetry, and the late-April high and the resistance line is the $21.25 - $21.50 area.
This is how high mining stocks might realistically go in the next few days before they turn south and decline with vengeance.
Please note that regardless of whether miners decline right away, or after another small move to the upside, the December – now price pattern will most likely become one big bearish Head & Shoulders pattern in the mining stocks.
Based on the size of the head (the highest point is the February top of $23.70), the downside target will be about $17.40. This would be a perfect confirmation of the target that we had already established for this downswing.
All in all, the situation in the mining stocks didn’t really improve. Yes, there might be some short-term strength here, but the enormous downside remains intact. The possible move higher seems too small to justify adjusting the trading position for the sake of it.
Moreover, there’s a specific pattern regarding the previous tops. Please note that it usually takes a few days for the top in miners to form. The three major tops of 2019: the February top, the March top, and the April top all took place over 3 or 4 days. The October 2018 top took even more. The July 2018 top took – again – 4 days. The January 2018 top – 3 days. The September 2017 top – 4 days.
What we see right now is not a top that’s as major as the previous ones… yet. If the profound decline follows from these levels, it will become such and since the latter is likely, it should be normal for one to expect this top to be formed over 3-4 days. If we count the early May upswing as a part of the top, then it might already be completed. But, if we look at this week’s news-based rally alone, we have seen only 2 days of the topping action. This means that one or two daily closes close to the current price level should not be surprising.
In fact, we might even get a move slightly higher and this might even take place while gold declines.
Looking for Guidance to the Miners-to-Gold Ratio
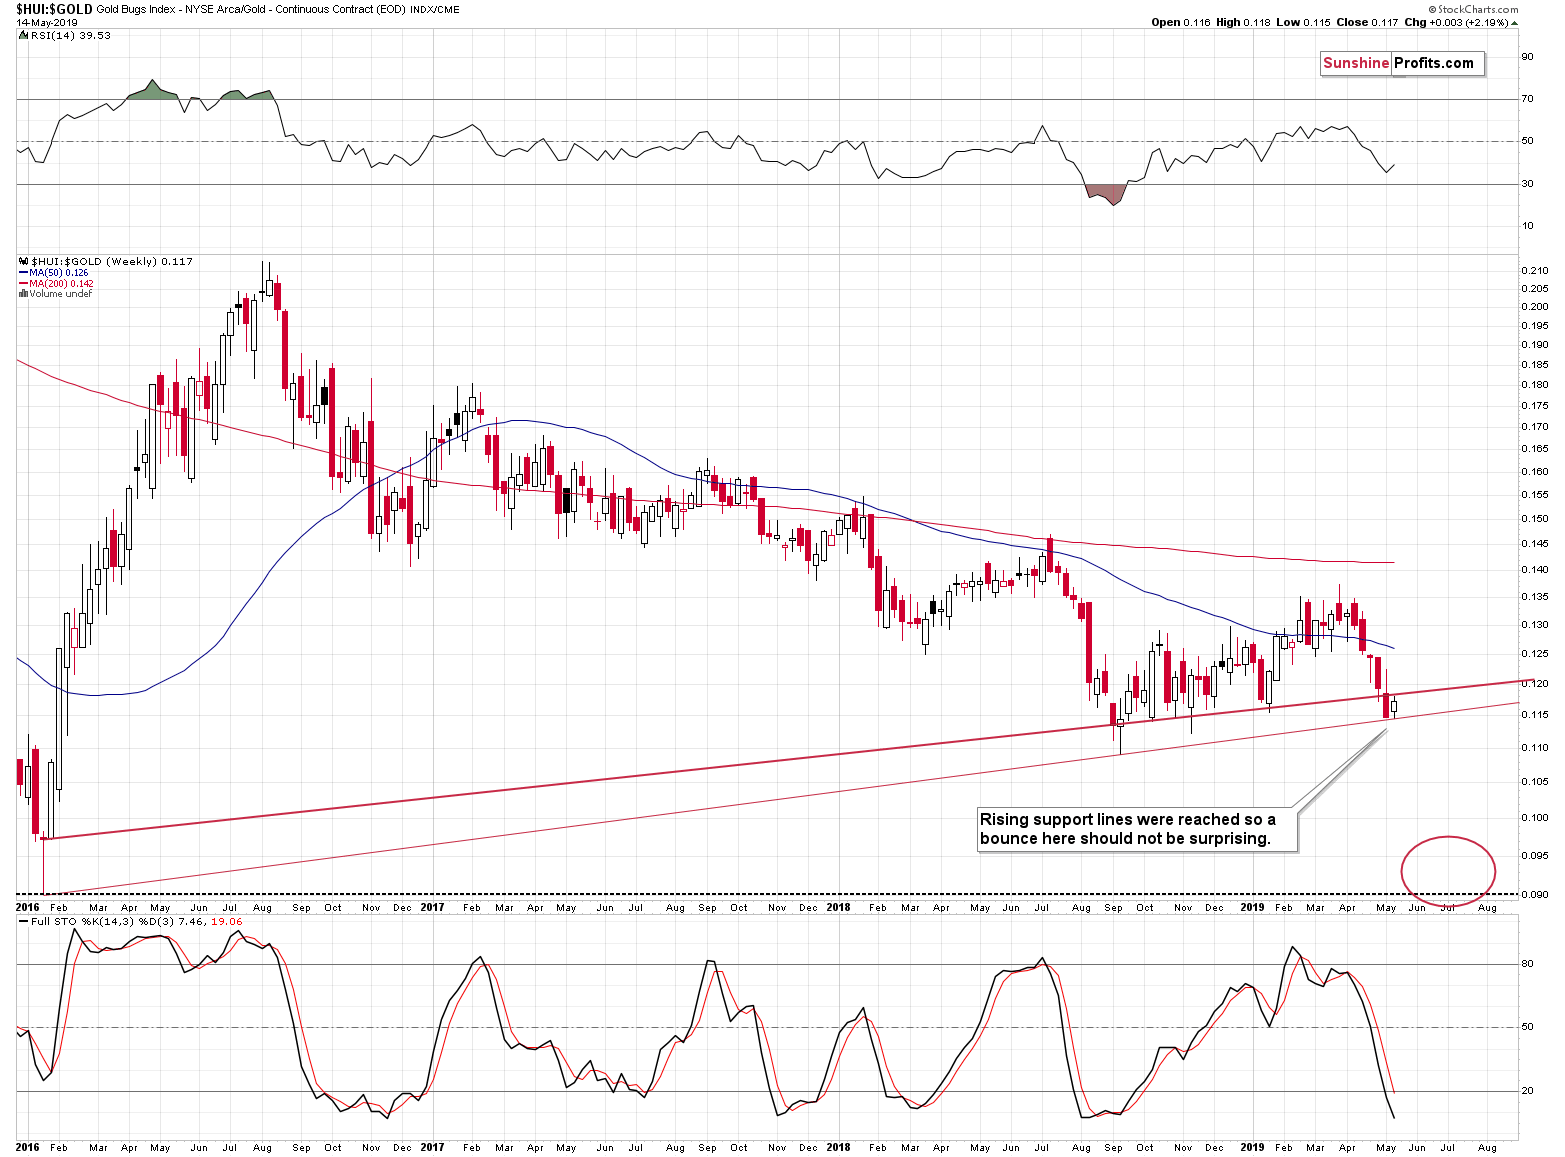
The gold stocks to gold ratio moved sharply lower recently and it reached its rising support line. This means that a bounce here would not be surprising. Naturally, the HUI to gold ratio might slide lower right away, to its 2016 bottom, as there is very little support below the 2018 lows. However, based on the current support line, it’s definitely not inevitable that it would do so in the next 2 weeks.
So, what does it mean? It means that if miners show some relative strength soon and perhaps refuse to slide while gold invalidates its earlier breakouts, it will most likely not be a sign of true strength. It will much more likely be just a breather within a much longer episode of miners’ underperformance.
Summary
Summing up, at first sight, it may seem a lot has changed based on Monday’s rally in gold and mining stocks. That’s not the case, however. The breakout in gold is not confirmed and is similar to rallies that took place right before the most important tops of 2018 and 2019. The triangle-vertex-based reversal in gold is just around the corner, and the same goes for the cyclical turning point in the mining stocks. Plus, options expire on Friday. It doesn’t seem that this news-driven rally will be able to do much more than delay the big decline by just a few more days. We might see the decline resume right away, but we might also see it resume on Friday or early next week. The much more important thing is the likelihood that the big decline is coming anyway than whether it starts now or in a few days. The potential profits on the slide are huge and definitely worth waiting a few extra days. While the targets for silver and mining stocks are relatively clear, it will be critical to check when – the most precise – target for gold is reached and act at that time.
Today's article is a small sample of what our subscribers enjoy regularly. To keep informed of both the market changes and our trading position changes exactly when they happen, we invite you to subscribe to our Gold & Silver Trading Alerts today.
Thank you.
Przemyslaw Radomski, CFA
Editor-in-chief, Gold & Silver Fund Manager
Sunshine Profits - Effective Investments through Diligence and Care
* * * * *
All essays, research and information found above represent analyses and opinions of Przemyslaw Radomski, CFA and Sunshine Profits' associates only. As such, it may prove wrong and be a subject to change without notice. Opinions and analyses were based on data available to authors of respective essays at the time of writing. Although the information provided above is based on careful research and sources that are believed to be accurate, Przemyslaw Radomski, CFA and his associates do not guarantee the accuracy or thoroughness of the data or information reported. The opinions published above are neither an offer nor a recommendation to purchase or sell any securities. Mr. Radomski is not a Registered Securities Advisor. By reading Przemyslaw Radomski's, CFA reports you fully agree that he will not be held responsible or liable for any decisions you make regarding any information provided in these reports. Investing, trading and speculation in any financial markets may involve high risk of loss. Przemyslaw Radomski, CFA, Sunshine Profits' employees and affiliates as well as members of their families may have a short or long position in any securities, including those mentioned in any of the reports or essays, and may make additional purchases and/or sales of those securities without notice.
 Przemyslaw Radomski, CFA, is the founder, owner and the main editor of SunshineProfits.com. You can reach Przemyslaw at: http://www.sunshineprofits.com/help/contact-us/.


