Gold's 'Black Hole' Window Rapidly Approaching


Last week's trading saw gold forming its high in Monday's session, here doing so with the tag of the 1962.90 figure. From there, a sharp decline was seen into late-week, with the metal dropping all the way down to a Thursday low of 1851.00 - before bouncing slightly off the same into Friday's session.
Recapping the Cycles
From the comments made in past articles, the correction off the 2089.20 swing top came as a result of the 72-day time cycle, which is shown again on the chart below:
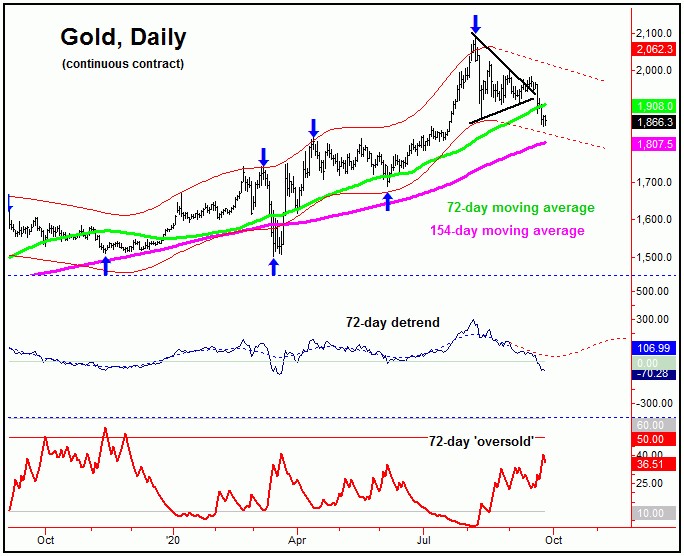
In terms of time, this 72-day cycle has been projected lower into this late-September timeframe or beyond, where we expect the next bottom of significance to form for gold. In terms of price, the 72-day moving average was noted as an ideal minimum price magnet to the current decline. Once again, this was due to the statistical fact that 85% of the correction phases of this cycle will see a reversion back to this key moving average. With the action seen into last week, this expectation has been met.
Gold's Reversal Dates
In addition to the projected periods of strength and weakness with the time cycles, we also use 'reversal dates' to help fine tune more precise windows when we expect peaks or troughs to form. For example, the most recent reversal dates were noted for September 8th, September 15th, and September 23rd.
Take a look at the next chart:
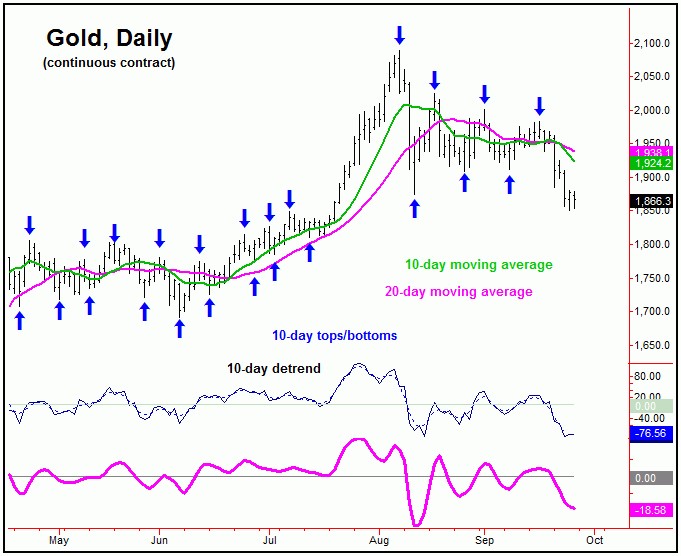
The chart above shows the smallest daily cycle that we track, the 10-day wave. Of note is that the September 8th 'reversal date' ended up as the last trough for this cycle, with the September 15th date projected to be a peak with this component - which was made on September 16th, within the normal plus or minus variance. From there, the next reversal date was noted for the September 23rd timeframe - which we are now into, and is looking to be a minor bottom with this wave.
With the above said and noted, we have identified a key 'reversal date' range - one that has the above-average potential to mark the low for the larger swing down with the aforementioned 72-day time cycle. We are referring to this as the 'black hole' window - which is rapidly approaching - with precise details in regards to the same noted in our thrice-weekly Gold Wave Trader report.
Mid-Term Picture
In terms of patterns, as mentioned many times in prior articles, the probabilities favor the current decline to end up as a larger countertrend affair - which means that gold should hold above the June trough of 1691.00. If correct, the overall path is looking for a push up to the 2200's or better on the next swing up, due again to the position of the larger 310-day and four-year cycles, with the larger four-year wave shown below:
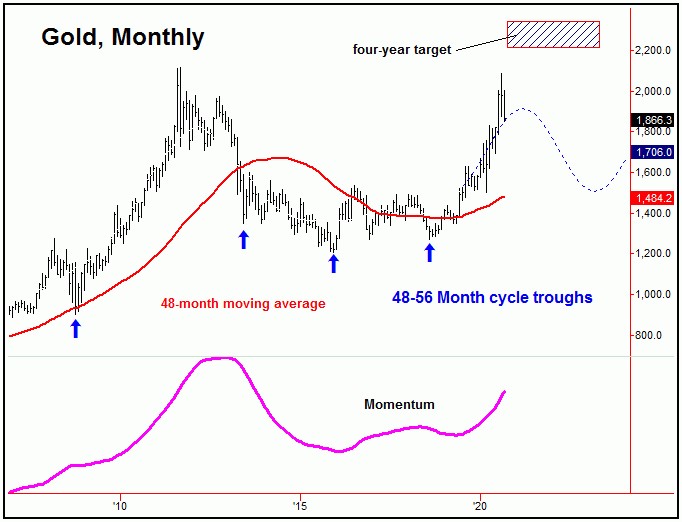
In terms of price, as mentioned in past months, there is an open upside target for this four-year wave to the 2212.00 - 2340.56 region for gold, which we expect to be met at some point in the months ahead. That range could also provide a major resistance level for the metal, which will then be looking for a much larger percentage decline into what is looking to be the Spring of 2021, once again with more exact details noted in our Gold Wave Trader report.
U.S. Stock Market (Update)
From the comments made in past articles, the downward phase of our 45-day cycle was seen as in firm force in the U.S. stock market - as measured by the S&P 500 index, or 'SPX'. Here is that cycle once again:
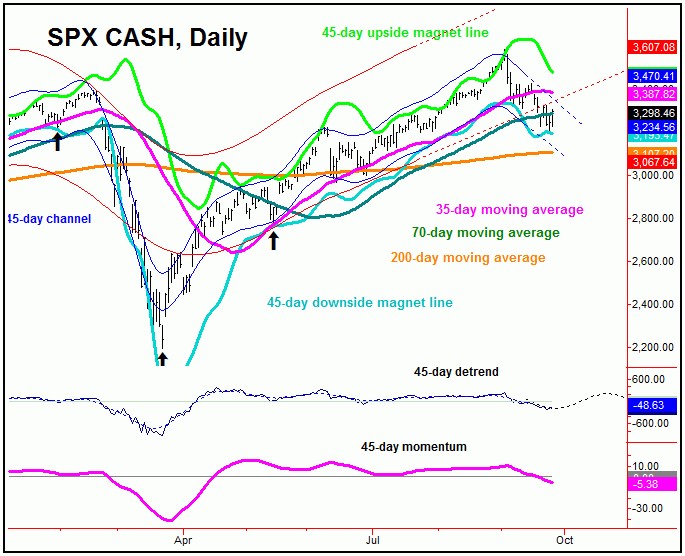
In terms of time, this 45-day wave has been projected to trough into this late- September timeframe - which we are now at or into. In terms of price, the 35-day moving average was our minimum magnet, with the patterns favoring this decline to end up as countertrend - against the June trough of 2965.66 on the SPX. This is due to the position of our larger 360-day cycle, which is shown again on the chart below:
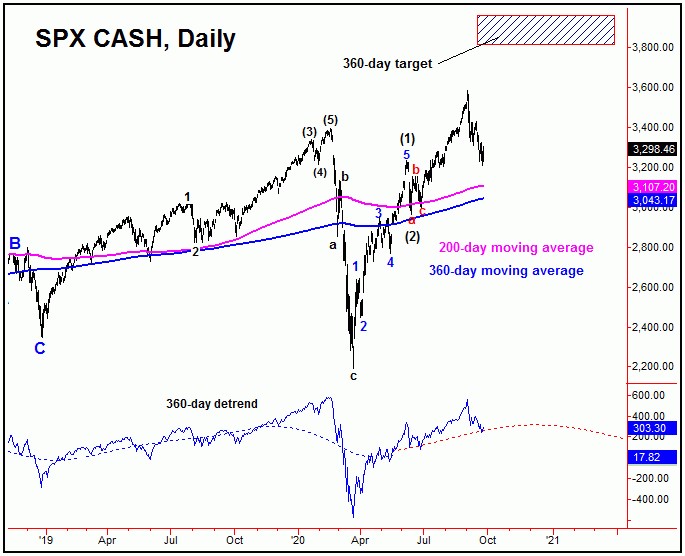
In terms of time, this 360-day cycle is projected higher into at least the late-2020 timeframe, though is more likely to remain in force well into the late-Spring or early- Summer of 2021. In terms of price, as noted in past articles, there is an open upside target from this wave to the 3812.56 - 3960.44 SPX CASH region - which we expect to be met in the coming months.
If the larger uptrend is to remain intact for U.S. stocks well into next year, then we should expect the current decline phase to end up as a countertrend affair. If correct, then a push back to new all-time highs is favored to follow, once again with the above target range in mind.
The Bottom Line
The overall bottom line is that both gold and U.S. stock cycles are at or into the range where a countertrend low is expected to form. Once complete, our ideal path is looking for a push back to or above the late-Summer highs to materialize in both markets, where we will be on the lookout for the next mid-term peak to form. From there, we are expecting a larger-degree decline to play out into next year, but a move which is favored to end up as a bigger countertrend affair, giving way to higher highs on the next swing up into what looks to be the late-2021 to Spring of 2022 range.
Jim Curry
The Gold Wave Trader
http://goldwavetrader.com/
http://cyclewave.homestead.com/
More from Gold-Eagle


