Gold's Coming Low - US Stocks Bottomless Pit


Last week's trading saw gold forming its low in Monday's session, here doing so at the 1576.30 figure. From there, strength was seen into late-week, with the metal pushing up to a Friday high of 1692.80 - before backing off the same into the weekly close.
Gold Market, Short-Term
For the very short-term, the smallest cycle that we track for the gold market is the 10-day wave, which is updated to the current action, and shown on the chart below:
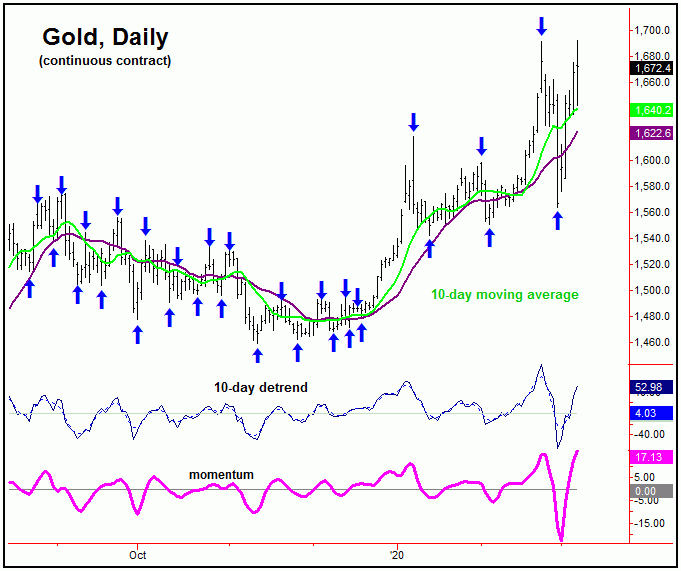
Even with the sharp (and expected) decline into late-February, we were looking for a low with our 10-day cycle to give way to decent short-term rally. In terms of time, we identified the March 6-9 timeframe as the ideal range for this rally to play out into - and to eventually conclude. With that, we are now looking for the next downward phase of this wave to assume control, which should put the 10-day moving average as the minimum magnet to price.
'Kill Zone' and the 3-5 Week View
In terms of time, as pointed out in past weeks we had identified the late-February to early-March region as the 'kill zone' to the prior rally phase. That rally was expected to top the slightly larger 34 and 72-day cycles, for what is expected to be a decent decline into the month of April. Here again is the larger 72-day wave:
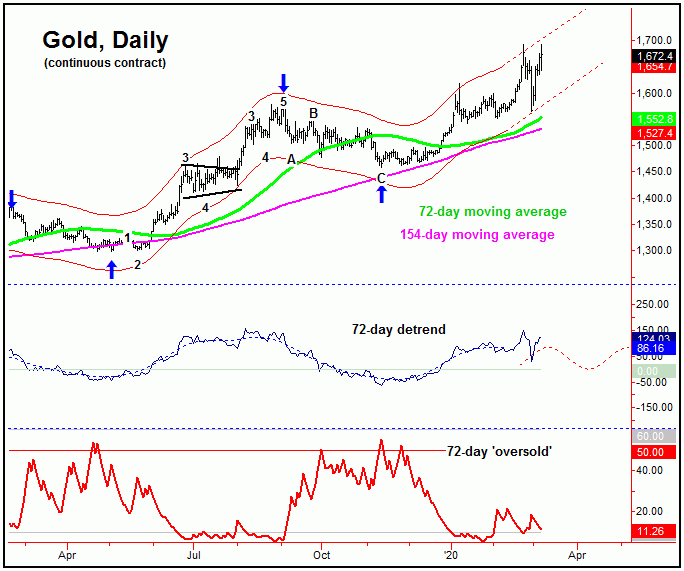
Stepping back, the overall assumption is that an eventual drop back to the 72-day moving average will be seen into the month of April. In terms of patterns, that decline is again expected to end up as countertrend, holding at or well above the November, 2019 trough - the last bottom for this 72-day component. If correct, then the probabilities are 80%-or-better that the next upward phase will take the metal back to higher highs again, then to peak the next larger component, the 154-day cycle:
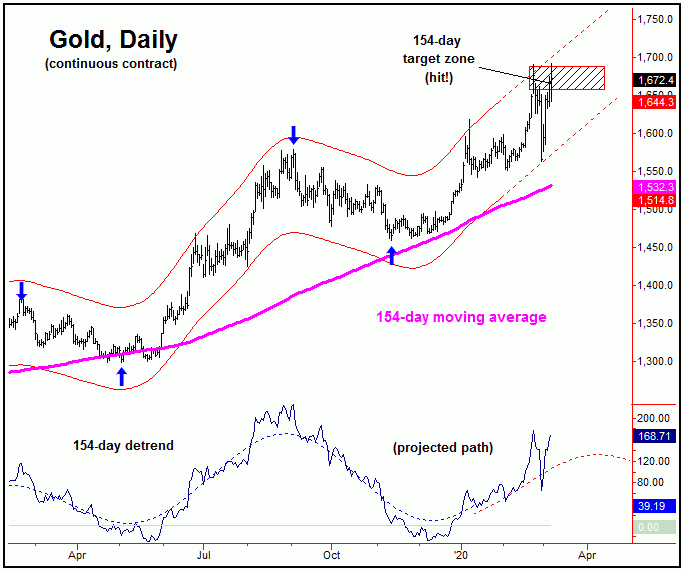
Stepping back even further, the low seen with the 154-day wave (i.e., early-Summer) should see the 154-day moving average acting as a magnet - with this key moving average currently extrapolating to the 1590-1600 region into that timeframe. In terms of patterns, the next 154-day trough should also try and hold above whatever low that forms with the smaller 72-day wave into April. If correct, the strongest rally of the year is expected to play out into later this year - with the 1800-2000 region or better acting as the eventual magnet.
US Stock Market in Bottomless Pitt
From the comments made last weekend, the recent reversal below the 3315.82 SPX CASH figure was the confirmation that the mid-term cycles had topped out with U.S. stocks - and with that were heading into their largest-percentage decline of the year, one which would see the 200-day moving average acting as the minimum expected magnet - but with the obvious potential for a drop back to the 360-day moving average:
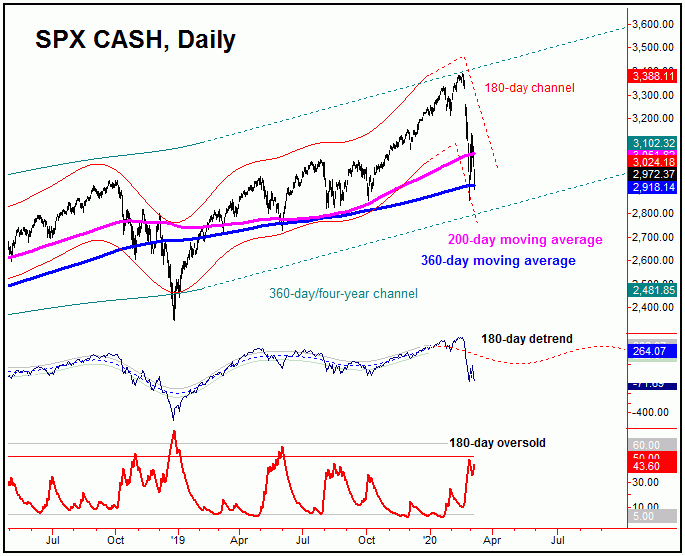
With the above said and noted, the downward phasing of the 180-day and 360-day cycles is still deemed to be in force, with the next mid-term trough expected to come from these two waves. In terms of price, where this low will come from remains to be seen, and it is too early in the cycle to confirm an upside reversal level for the same. In terms of time, however, the next major low is projected for the mid-May timeframe or later.
Even with the mid-term cycles currently pointing lower, there could be many very sharp rallies seen in-between. Take a look at our next chart:
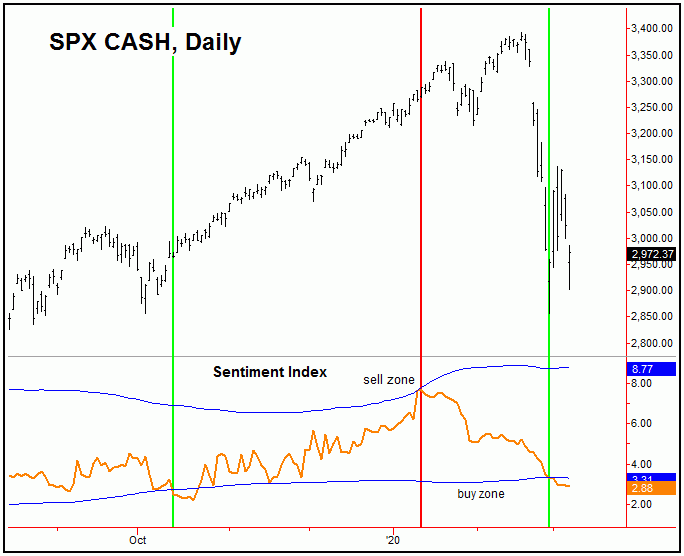
The chart above is our stock market sentiment index, which is a proprietary sentiment indicator, which we update and publish each weekend in our weekly Market Turns report. With this particular indicator, any move below the lower blue band is considered to be a buy signal, while any move above the same band is considered to be a sell signal.
Going further with the above, the last buy signal with sentiment came back in mid- October of 2019, which was followed by the rally seen into January of this year. From there, the indicator reversed back to the sell side of the market back in mid-January - though this came well ahead of the actual price peak in February.
As for the more recent action, a net positive is that this indicator recently moved back to the buy side of the market, doing so on February 28th at the 2954 SPX CASH figure. With that, I view this as being supportive of a sharp short-term rally going forward, though these signals can come well before the actual market turn.
Going further with the above, the next short-term low should come from the bottoming of the smaller 45-day cycle, ideally made around the latter part of this month - though from what price level is speculation. Here again is that cycle:
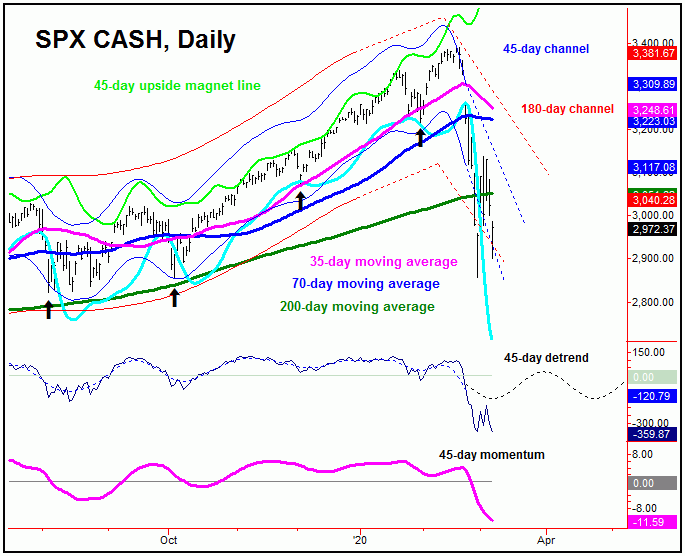
Once the next trough for this 45-day cycle is in place, then the SPX should see a sharp rally, one which takes the index back to its now-declining 35-day moving average into around mid-April, plus or minus. Until proven otherwise, that move would be favored to end up as a countertrend affair, and - if correct - should give way to lower lows on the next downward phase of this wave, which would appear to be the odds-on favorite to bottom the larger 180-day cycle for a multi-month rally into later this year.
Summing It Up
The overall bottom line with the above is that gold should be peaking again in the current timeframe - to be followed by a larger (countertrend) bottom in the coming month or so, made with the 72-day time cycle - one which we are looking to buy. As for U.S. stocks, the downward phasing of the mid-term cycles is still deemed to be in force, though we are expecting several sharp countertrend rallies in-between - the first of which is due to materialize at anytime.
Jim Curry
The Gold Wave Trader
http://goldwavetrader.com/
http://cyclewave.homestead.com/
Jim Curry is the editor and publisher of The Gold Wave Trader and Market Turns advisories - each of which specializes in the use of cyclic and statistical analysis to time the Gold and U.S. stock markets. He is also the author of several trading-related e-books, and can be reached at the URL's above.
********
More from Gold-Eagle


