Gold's Final Rally Phase


Last week's trading saw gold forming its low in Wednesday's session, here doing so with the tag of the 1877.10 figure. From there, a sharp rally was seen into later in the week, with the metal running all the way up to a Friday peak of 1936.80.
Potential Cycle Bottom In Place
From the comments made over the past month, the last good swing top came as a result of the 72-day cycle, which peaked back in August at the 2089.20 figure. From there, the outlook called for a minimum drop back to the 72-day moving average, which was seen into late-September - where this wave was projected to trough:
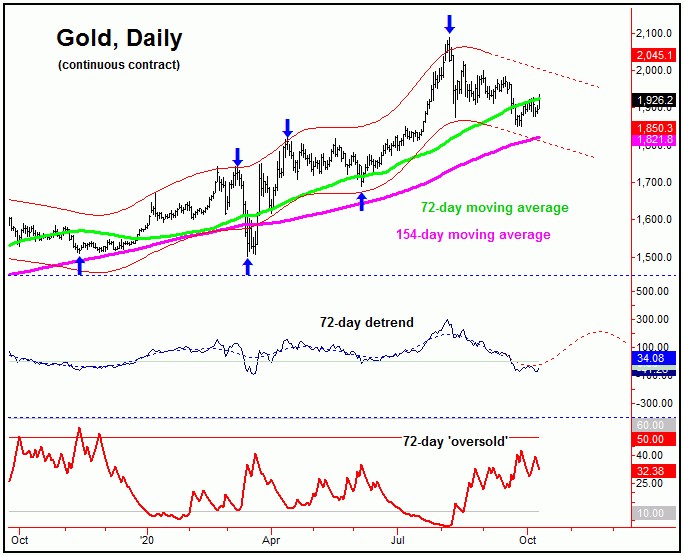
With the above said and noted, we were able to go long the GLD (i.e., Gold ETF) into the late-September weakness, and are holding with a tidy net profit. Having said that, there is yet no actual confirmation that our 72-day cycle has bottomed, which leaves the door open to a potential lower low (or re-test of the lows) in the near-term.
Right now, in order to actually confirm a larger trough in place with our 72-day wave, gold would currently need to see a reversal back above the 1985.10 figure for the December, 2020 contract. This number could start to drop in the days ahead, with the latest numbers noted in our thrice-weekly Gold Wave Trader market report.
Gold's Mid-Term View
With the above said and noted, gold either bottomed with the late-September tag of the 1851.00 figure (which could only be confirmed by a reversal back above the 1985.10 figure) - or else has a marginally lower low still out there. Regardless of which path plays out, our assumption is that a push back above the 2089.20 swing top will be seen on the next 72-day cycle upward phase, one that plays out into later this year.
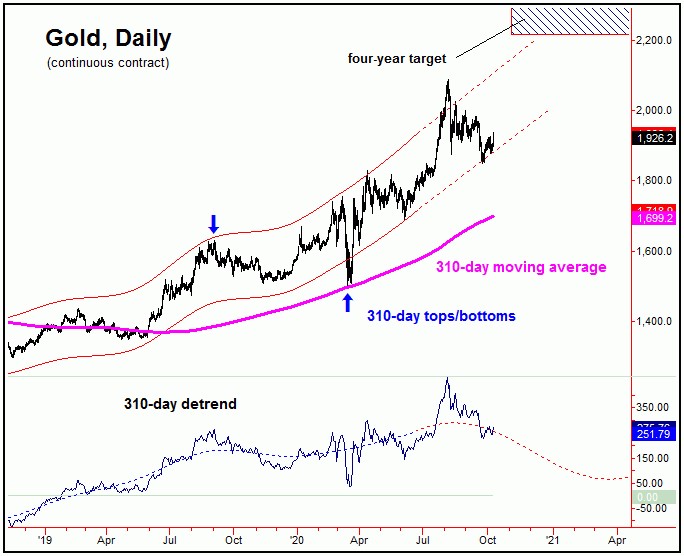
For the mid-term picture, the larger 310-day cycle (chart, above) and four-year wave are still deemed to be heading higher, at least until proven otherwise.
From my 9/13/20 article: "the upward phase of the smaller 310-day cycle is expected to remain intact into at least the Autumn of this year. In order to keep this upward phase intact, gold should remain above lower (and extrapolated) channel support, which we can see is currently around the 1850 level - but which is also rising daily."
As pointed out, support to the correction phase of the 72-day wave was mentioned as being the 1850 level, plus or minus, with the actual low so far coming in at the 1851 figure - nearly a direct hit. Even said, until proven otherwise by a reversal above the 1985.10 figure, we can't yet confirm our 72-day cycle to have bottomed - though the tag of the 1851 figure does look ideal.
Gold's Final Rally Phase
As per the title of this article, the next upward phase of the 72-day cycle should be the final rally phase into the next mid-term peak - which should come from the larger 310-day cycle. In terms of price, the ideal path is looking for an eventual push up to the open four-year target zone to 2212.00 - 2340.56 for gold.
Adding to the notes above, the upper-end of our four-year target zone (i.e., 2300's) is also a major resistance level. That is, if tested on a technical contraction, it would be the odds-on favorite to top this 310-day cycle, for what is anticipated a very sharp correction into the Spring of 2021.
The Bottom Line
The overall bottom line is that the correction phase off the August peak has either bottomed, or else has a marginally lower low to go - with the dividing line being the 1985.10 figure (December, 2020 contract). Either way, the overall path favors a push back above the 2089.20 swing top into later this year, before forming the next mid-term peak - expected to come from our larger 310-day component. From that high, we will be looking for a much larger-percentage decline to play out into the Spring of 2021, one which is favored to end up as another countertrend affair - giving way to higher highs into late-2021 or beyond. Stay tuned.
Jim Curry
The Gold Wave Trader
http://goldwavetrader.com/
http://cyclewave.homestead.com/


