Gold's Historic Low Volatility


Much has been made of the volatility investors endure in the gold market. No doubt about it, the golden bull has a way of throwing off the faint hearted investor who hasn't studied how things are done in his rodeo. But in fact, since 2001,volatility in the gold market has never been more moderate. Price volatility in the gold market from 1969-99 wasmuch worse. But with the "huge" recent price swings in gold, how is this possible? It's possible because most people today base their investment decisions on the views of "market experts" who base their opinions on dollar price swings, not percentage moves. Contemporary "market experts" serve as marketers of inflationary "investment products" developed by their Wall Street employers. They have a personal interest in keeping people's money in financial assets, not gold and silver related investments.
Back in 1969, when gold was selling for just a tad over $35 an ounce, there were no billionaires. But today we live in a world where we have lots of them. On Tuesday of this week, we saw gold move $48 in a single trading session. In 1969, a $48 move would have more than doubled the price of gold in a single day. Last Tuesday, a $48 gain only moved the price of gold by 2.91%. The fact that no one in the financial media has ever thought of making this price to percent comparison between 1969 and now shows just how effective the colleges and universities have been in dumbing down their students' understanding of the hazards of unchecked monetary inflation. But why should we expect "higher education" to have a kind word for gold and silver, or speak ill of "monetary policy?" Since college professors manage the Fed's criminal empire, in exchange for Washington's school loan program and government research grants, the conflict of interest is obvious.
Fifty years ago, major banks in Minnesota used to advertise they held $450 million dollars in deposits, boasting of their deep pockets. How things have changed just four decades later; billionaires (most of them left-leaning Democrats) are now a dime a dozen. But their billions-of-dollars are mostly defined in inflated financial assets or real estate, whose prices have been bloated to grotesque proportions by years of open-market-operations at the Federal Reserve, and then leveraged upwards by fractional reserve banking. In 2011, dollar denominated wealth has never been so precarious.
Rising gold and silver prices place this presumed wealth at great risk. This is especially so in the bond markets, where governments can "voluntarily" donate 50% to 90% of bond holders' wealth to a third party (influential banks, or unions) as investors in American auto manufacturing, and Greek sovereign bond debt have both discovered. But since the start of the global-credit crisis in 2007, how often have bond holders looked enviously at the price of gold? The global financial empire's concern is that a day is coming when stock and bond holders will stop looking at the price of gold and silver, and begin buying gold and silver. It's just a matter of time (possibly years) before trillions of dollars panic into hard assets.
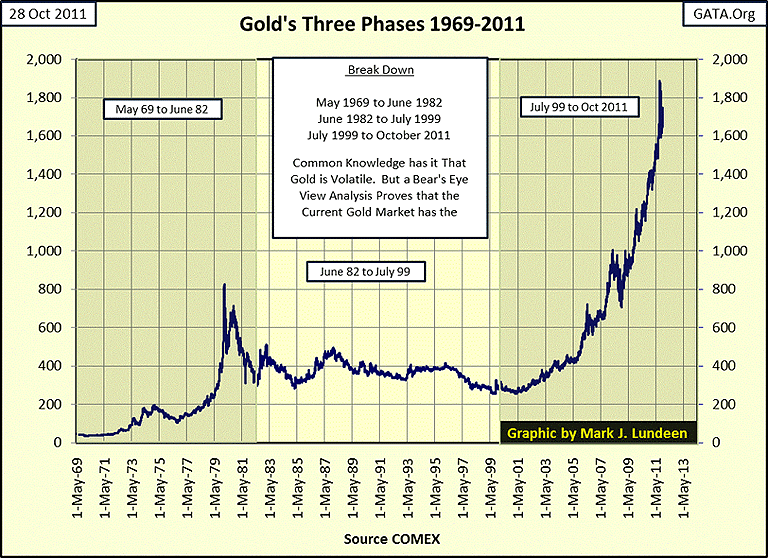
Here is the daily price chart of gold from 1969 to 2011. To examine gold volatility I've divided the forty-two years into three periods to analyze with my Bear's Eye View (BEV) technique, seen later in this article. Since 1969, gold has seen two bull markets and one bear, and it very interesting when we compare these markets' volatility. But note that I started the 1980-1999 bear market in 1982, a point where gold had already declined 64% from its highs of 1980.
To explain why I did this, I suppose I should explain my Bear's Eye View (BEV) technique, as I haven't done so for a few months. The Bear's Eye View evaluates every data point in a price series to determine if it is a new high of the move. If it is, the BEV formula assigns a Zero Value to it, and * NEVER * more. If the data point is not a new high of the move, the BEV formula converts it into a negative percentage * FROM * it's the last high of the move. In a nutshell, a BEV plot depicts price data in a range of 100 percentage points. BEV Zeros are new highs of the move, and -100% is a total wipeout in an asset's valuation.
The Bear's Eye View is exactly what it claims to be! Mr Bear doesn't care how far the bulls take a market up in price. If a new high of a move is 1% or 100% above the previous high of the move, it's all a big-fat ZERO to the big furry fella. The only thing Mr Bear cares about is how large of a percentage can he claw back from the bulls' gains.
The formula for converting price data into a BEV plot is simple:
(Price/Highest Price of the Move) - 1
The BEV plot is an excellent means to analyze inflated dollar price data that's been ravaged for decades by central banking, as it levels the inflationary playing field over the decades.
No doubt about it, in every bull market, there comes a day when it sees its last all-time high, or in BEV terms, the bull market's Terminal Zero. Here is a BEV chart for the Dow Jones spanning from 1885 to present.
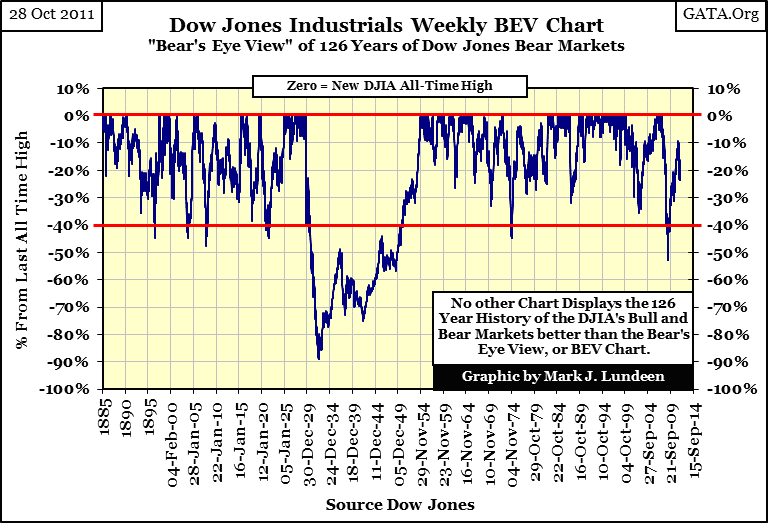
We see plenty of BEV Zeros during bull markets, if not the magnitude of the gains. Terminal Zeros, the last all-time high of a bull market, identify the actual beginning of bear markets. Something I chose * Not * to do in the gold chart above for the 1980 Terminal zero, for reasons that will be made clear below.
In the BEV chart above, every Dow Jones bear market since 1885 is displayed in percentages, so is comparable to every other bear market during the 123 year span in time. The Bear's Eye View makes it very clear why the 1929-32 market crash was so horrific. Its impact left a crater in the stock market that spanned from 1929 to 1954. Here is something you should keep in mind: the 89% crash from 1929-32 was from a price decline of $338.95 in the Dow Jones, while on Thursday, October 27th the Dow Jones saw a gain of $339.51 points. Eighty two years after the Great Depression bear market; last week's $339.51 move in the Dow resulted in a percentage gain of only 2.40% in the BEV chart above. Why the huge difference in percentage impact on a BEV chart from an almost identical price move? Because, the Federal Reserve has been busy trashing the US dollar for the past eight decades. Like a billion dollars, $339.51 just doesn't buy what it used to.
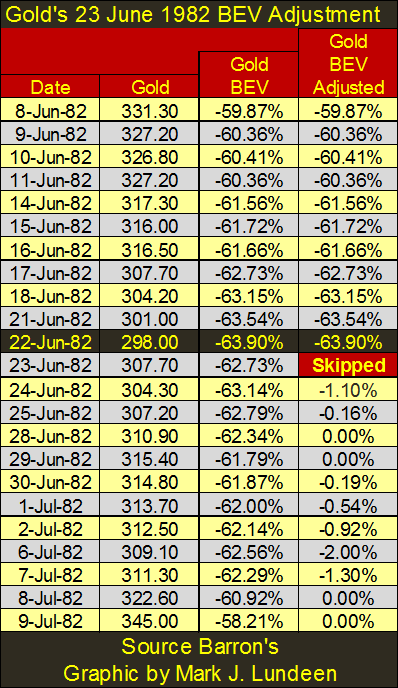
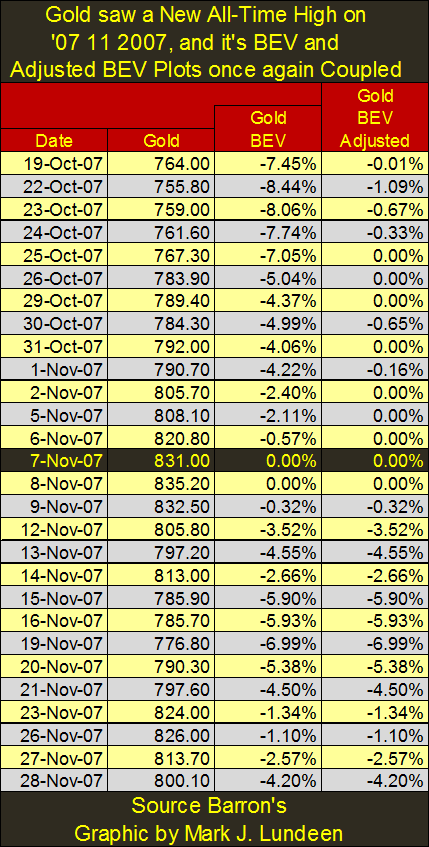
Before we move on to show how gold's volatility since 1999 has been greatly reduced, there is one more thing to address: adjusting a BEV Plot. Sometimes it makes sense to adjust the BEV series after a huge decline. For example, gold's terminal zero in 1980 marked the actual beginning of the bear market, but after gold's 1982 dramatic bottom, it makes more sense to terminate the BEV series, and restart the BEV plot at a much reduced price in a bear market rather than continuing the BEV series from gold's record high price set in 1980.
Gold's BEV data is shown in two columns in the table. The "Gold BEV" data is based on the last high of the move ($825.50), seen on 21 January 1980. But in 1982, after gold's steep decline, a dollar move for gold amounted to a pretty insignificant BEV percentage change for someone who had purchased gold at the top. So to show how a dollar move impacts someone who purchased gold at its 1982 bottom ($298.00), I adjusted (reset) the BEV series to 22 June 1982.
Here's my forty-two year BEV chart for gold, using the two data series seen in the table above. We can see exactly how the June 1982 adjustment worked, by looking at the red plot of 1982 to 1999 as a separate bear market in and of itself, rather than as a tail attached to the steep 1980 to 1982 decline of the blue plot. Note that I did another adjustment in July 1999, at the exact bottom of the 1980-99 bear market in gold. This final BEV plot adjustment allows a direct comparison of volatility between the 1969-80 bull market and its following bear market in gold, and our current bull market. And just as I said, the comparison proves that since 2001, gold has seen its most tranquil period since 1969.
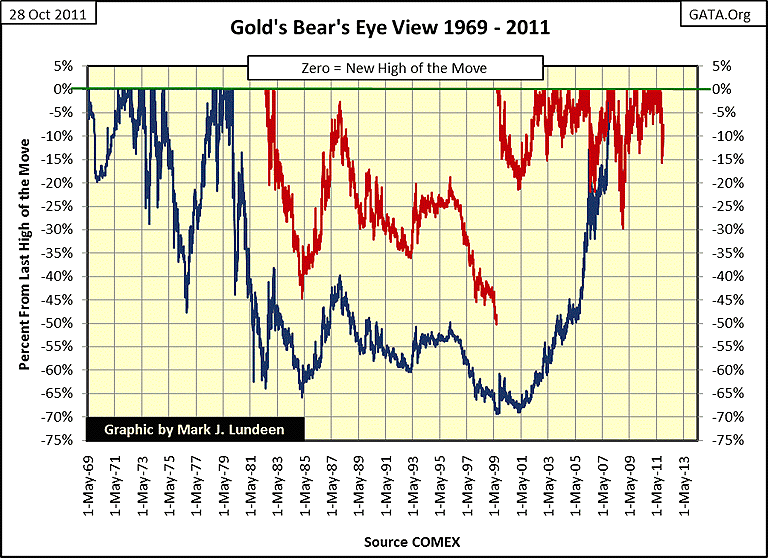
But what exactly does that mean? Well look at the chart, and consider what happened to someone's investment in gold from 1969 to 2011, if they purchased gold at the worst possible moment in time: at a BEV Terminal Zero, or exact top prior to a big decline. From 1969 to 99, in either the bull or bear markets, losses of over 40% were common. And not only that, for thirty two years (1969-2001), gold's price snap-backs to new BEV Zeros were leisurely; typically taking years. I think it is significant that since 2001, when the US began inflating a massive bubble in the real estate market that still plagues the global financial system to this day, this has not been the case for gold! Since 2001, there has only been one 30% decline in the price of gold from a BEV Zero, and since 2001, all snap-backs to a new BEV Zero were quickly accomplished!
This Bear's Eye View analysis of the gold market strongly suggests that our current bull market in gold is something new and different: smart money clearly wants out of US dollar denominated financial assets, and higher prices have not diminished their desire for gold one bit, (and yes silver too)!
Feel free to study the red BEV plots above before agreeing or disagreeing with me. In fact, I'd be pleased-as -punch if CNBC would take gold's closing price data from 1969, derive their own BEV plot as described above, and show it once a week in their programming. Looking at the Bear's Eye View provides the clearest understanding of the gold market from 1969 to present.
Technical Note: these plots did eventually sync up again when gold reached a new all-time high on November 7th, 2007. See table below. But Excel only shows the red adjusted plot in the chart.
The most important point made in this article is: as the gold continues to advance in price in our current bull market, a $50 move in price the price of gold will mean less and less in percentage terms. In any inflationary economy, current dollar prices, over time, will mean less and less when compared to past prices. So it's best to stick to percentages when measuring the gold market movements, and that is what the Bear's Eye View does so well!
Mark J. Lundeen
[email protected]
[email protected]


