Gold's Initial Tour Of The Final Frontier (1800-1900)


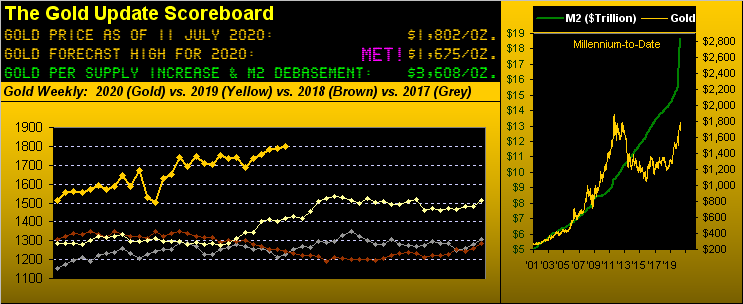
Gold's settling yesterday (Friday) at 1802 puts price within 100 points of the All-Time Closing High of 1900 as established back on 22 August 2011. As fervour builds to break that record, 'tis a good time toward maintaining perspective for another round of "Facts, Hercule, Facts!", (this image, of course, courtesy of the once iconic Mirisch Corporation):

"FACT! Gold's highest trade ever was 1923 on 06 September, 2011"
"FACT! Gold's highest close ever was 1900 on 22 August, 2011"
"FACT! Gold's next challenging tour is to cross The Final Frontier (1800-1900)"
"FACT! Gold's price at present is 1802"
"Now, Hercule, given these indelible facts, what can we say about the price of Gold right now?"
"That it is inside of The Final Frontier."
"No! That is what they want us to believe. Idiot! Have you not accounted for the daily parabolic trend being on the cusp of turning Short?"
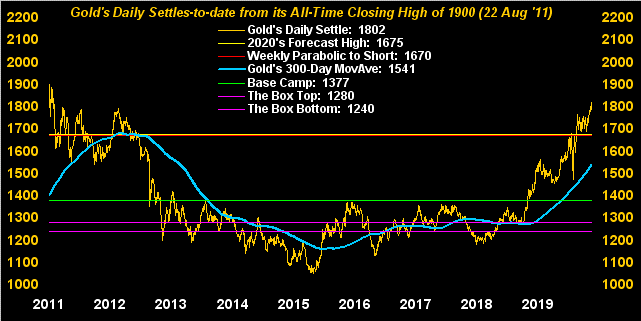
'Course, 'tis the Inspecteur's understudy who is right: obviously at this writing Gold indeed is inside The Final Frontier. But per the following chart of daily Gold since its low this past March at 1451, 'twould take just one wee pip of slippage below 1796.5 to then potentially push price back down well into The Northern Front (1800-1750):

Why are we drawing attention to this? Year-to-date, Gold has already completed five daily parabolic Short trends: the average downside adversity of those is -50 points. Were that average to play out, Gold shall essentially have given back The Northern Front in returning down to 1750. 'Course, "average" is not "actual", but 'tis something of which to be aware, rather than by which to be surprised should such occur. (A tip of the cap there to the "Buy Low, Sell High Dept.") As well, the present parabolic daily Long trend is 20 days in duration: another five days and 'twould tie the record for the "longest Long trend" in better than three years. All of this in the context that -- as penned a week ago -- Gold's having finally "taken" The Northern Front doesn't necessarily mean that it has as yet "won" it. Just sayin'...
Notwithstanding that cautionary note, in turning to Gold's weekly bars and parabolic trends, the yellow metal remains as healthy as ever in having recorded four consecutive "higher highs" within five straight weeks of higher closes. The result as clearly shown is Gold's now making an initial tour (for the first time in nearly nine years) up into The Final Frontier. As we've said, 'tis a zone (unlike The Northern Front) with very little overhead resistance given that back in 2011, price traded but 27 days in the 1800s. Here's the year ago-to-date weekly graphic:
Meanwhile to look at Gold's closes by the day since that highest ever back in 2011, the overall recovery (even with some 100 points still to go) appears (at a glance) almost complete:
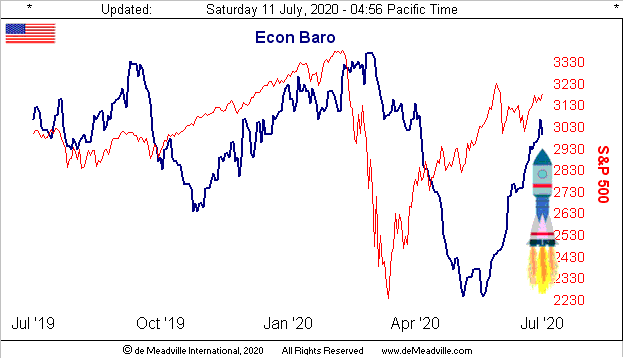
And speaking of recoveries nearly complete, have a look next at the Economic Barometer. As you regular readers and website viewers know, the Econ Baro is not so much an index as it is an oscillator. It thus dove swiftly from the onset of COVID only to have rocketed up rather magnificently as the StateSide economy has come back on line. This even as the venerable Reuters reported on Wednesday that "Fed Officials Suggest U.S. Recovery May Be Stalling" as COVID spreads her dread, (albeit many who have recently contracted the virus haven't felt sick a wit: oh the best-selling tomes that shall be written about this one, eh?) With 16 metrics in the balance for next week, here's the Baro from a year ago-to-date, the red line being the S&P 500:
Still, look for the economic shutdown to have impeded Q2 earnings, the season for which has only just begun. Typically with some 2000 reports that we'll collect, only 13 have been recorded thus far, for which just four (31%) bettered their Q2 of a year ago. As to our "live" price/earnings ratio for the S&P 500 now at 42.2x, 'twas already historically high when the year began at 39.0x. But as we again hasten to point out, when interest rates are zero and "free faux dough" is everyone's hero, it finds its way into the stock market.
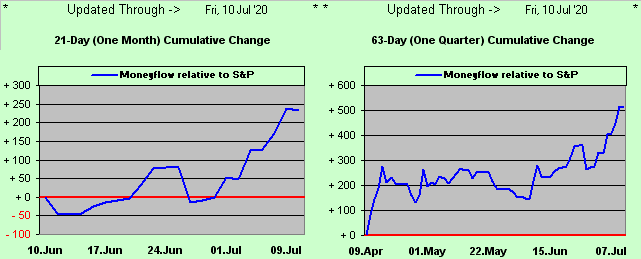
To be sure, Q2 earnings are expected to be a "Disaster": but one wouldn't know it if tracking the S&P 500's moneyflow as regressed into Index points. Have a look at this two-panel graphic of the points differential of the Moneyflow over the Index itself for the past month on the left and for the past three months on the right. Given the S&P (at present 3185) is just 201 points below its all-time closing high of 3386, both time-frames' positive differentials are suggestive of that high being eclipsed sooner than later by this leading indicator, lousy earnings be damned, as money looks beyond them:
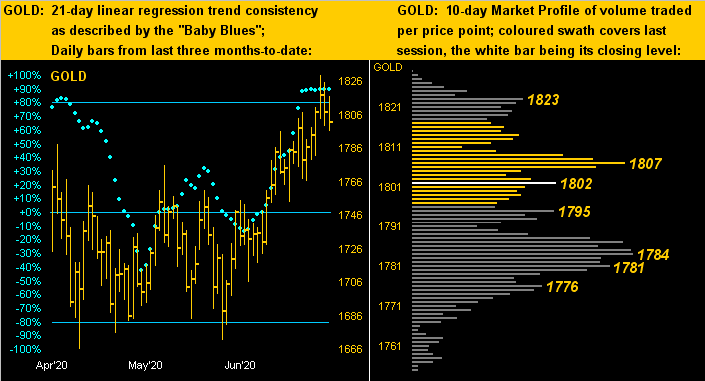
Meanwhile, as far from lousy as a market can get is Gold. Here in our two-panel graphic of price's daily bars from three months ago-to-date at left and 10-day Market Profile at right, we've a fine sense of "The Now." Gold's baby blue dots of linear regression trend consistency have begun painting themselves across the ceiling, even as price begins to come down, (indeed foretelling the aforementioned daily parabolic trend nearing a flip from Long to Short). And yet, a imminent trading range at least by the Profile appears from 1807 down to 1776, (bearing in mind nonetheless that such parabolic flip could complete a trip down across the entirety of The Northern Front to 1750, from which 'twould be "Here we go all over again"):
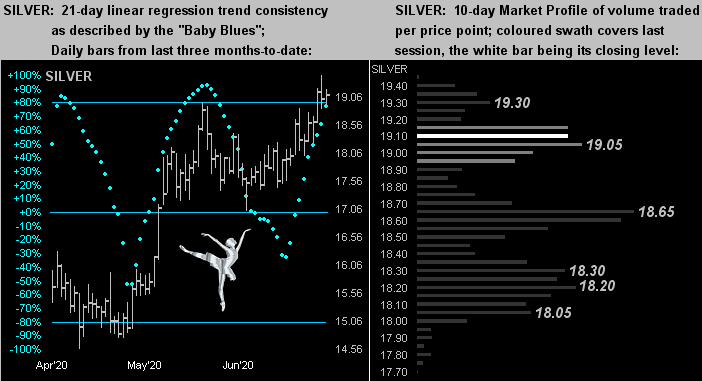
The similar graphic for Silver shows her being a bit firmer these past three months: from her March low (11.64) to her high (19.45) of just this past Thursday is an increase of 67%; (Gold's increase across the like span is but 26%). Still, the Gold/Silver ratio of 94.4x remains extreme by modern-day measuring, (the average since 2001 being 66.0x). 'Course, throw in a li'l miner's leverage such as that provided by PAAS (Pan American Silver) which since its March low has increased by as much as 214% (from 10.61 to 33.28), and who gives a derrière du rat, eh? Sister Silver at her dancin' best, that!
We're wrappin' it for this week in simply bidding San Francisco "Adieu"...
Mind your Gold (and Silver too!)
And as ever, from wherever,
Cheers to You!
www.deMeadville.com
www.TheGoldUpdate.com
**********

Mark Mead Baillie has had an extensive business career beginning in banking and financial services for two years with Banque Nationale de Paris to corporate research for three years at Barclays Bank and then for six years as an analyst and corporate lender with Société Générale.
For the last 22 years he has expanded his financial expertise by creating his own financial services company, de Meadville International, which comprehensively follows his BEGOS complex of markets (Bond/Euro/Gold/Oil/S&P) and the trading of the futures therein. He is recognized within the financial community of demonstrating creative technical skills that surpass industry standards toward making highly informed market assessments and his work is featured in Merrill Lynch Wealth Management client presentations. He has adapted such skills into becoming the popular author each week of the prolific “The Gold Update” and is known in the financial website community as “mmb” and “deMeadville”.
Mr. Baillie holds a BS in Business from the University of Southern California and an MBA in Finance from Golden Gate University.


