Gold's January? Ordinary!


Now before all y'all get yer boxers in a bunch over "How can you say 'Ordinary' when the likes of Franco-Nevada gained 10.6% for January?", remember: here at The Gold Update we tell it like it is. To wit:
For the first 18 years of this third millennium, (which for you WestPalmBeachers down there was 2001 through 2018), the average change in the price of Gold for January was +3.0% and the median change was +3.4%. Split the difference and what do we get? +3.2%, which was precisely Gold's net change for January 2019. That's as dead-center ordinary as it gets. Indeed with 19 of 'em now in the books, here is the table of Gold's respective January performances in descending order from +11.0% in 2012 down through -6.2% in 2011, again the centerpiece as framed being this past January's +3.2%:
'Course, it has felt much more exciting than that given Gold's having found its way back above The Box (1240-1280), sufficiently so that we can now morph such oft inescapable 40-point swath from resistance into support. In fact, add to price six fat points of April contract premium and for just the second time in over a year Gold has posted back-to-back weekly gains of better than +1% toward settling out this most recent one yesterday (Friday) at 1322. And in turning to Gold's weekly bars, the current parabolic Long trend of 21 ascending blue dots ties for fourth in duration since 2001 (with that ending 12 June 2009). Of marginal note as well, the ensuing week's price that would flip the trend from Long to Short is actually just atop The Box at 1283. Now if we can just get that nasty dashed regression line to rotate upward, we'll have the whole package sailing higher:
What's really sailed higher to start the year is Black Gold as we turn to the 2019 BEGOS Market Standings for one month plus one trading day year-to-date. Oil is, as they say, "crushin' it", up nearly 21% followed by the S&P 500 up 8%; only the currencies are in the red:
"So now are you giving up on your 27% correction call for the S&P, mmb?"
Good heavens no, Squire. In fact we had to laugh over the misleading light in which the S&P was cast in Friday's wee hours: "The S&P 500 turns in its best January in 32 years!" came the excited bedside Bloomy radio voice. 'Tis a fact, that. But from the "Change is an Illusion whereas Price is the Truth Dept.", the S&P finished January at 2704, the price at which it had last been just 37 trading days earlier on 07 December. Were we broadcasting, we'd have instead said "The S&P 500 has nearly completed its Gold Ratio retracement to 2719 as measured from the recent 2347 low up toward the all-time 2940 high as the overall 27% correction to 2154 continues." But that ain't gonna sell radio spots.
How about selling the Economic Barometer to the Federal Open Market Committee? One thinks they might actually be looking at it, having doveishly slipped "will be patient" into last Wednesday's policy statement. Indeed, 'twas again to laugh in reading the FinTimes above-the-fold headline that "Asia stocks rally on Federal Reserve’s rate reversal" You mean they did a rate cut and didn't tell us? 'Course all that was before Friday's StateSide report of blow-out January jobs creation exceeding the 300,000 mark, practically double expectations. The month's Institute for Supply Management Index on manufacturing also went up, but the Chicago Purchasing Managers Index went down, as did Consumer Confidence, whilst Hourly Earnings slowed and December's Pending Home Sales fell the most in five years. Here's the Baro as the Great Divergence continues:
Divergence as well away from lower levels is the name of the Gold equities game. Here is the chart of their respective percentage, er uh, losses from one year ago to date (save for one wee gainer) But let's drill down into how each entity has done just from its recent January low to its January high: Gold itself +4.4%; Newmont Mining (NEM, post Goldcorp acquisition) +11.7%; the VanEck Vectors Gold Miners exchange-traded fund (GDX) +12.2%; the Global X Silver Miners exchange-traded fund (SIL) +12.8%; Franco-Nevada (FNV) +14.6%; and NEM's acquiree Goldcorp (GG) +19.3%. Not bad for less than a three-week span if you've the trade timing of a Swiss watch, (and you know that I know who you are out there):
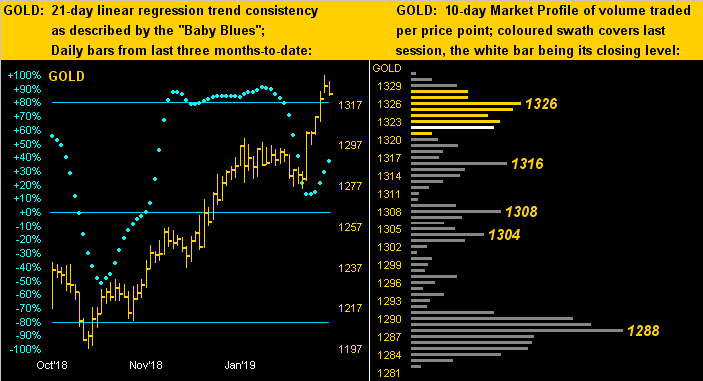
Onward with Gold itself we next move to its two-panel chart of daily bars from three months ago-to-date on the left and 10-day Market Profile on the right. Note that this most recent price rise defied the declining baby blue dots of linear regression trend consistency, the latter rather than accelerating lower (the technical rule) instead having abruptly reversed upward (the technical exception): that is an anomaly across the respective tracks for all the BEGOS Markets, but there 'tis. In the Profile, we've some decent support struts in these lower 1300s, with 1288 being the most frequently traded price over past fortnight:
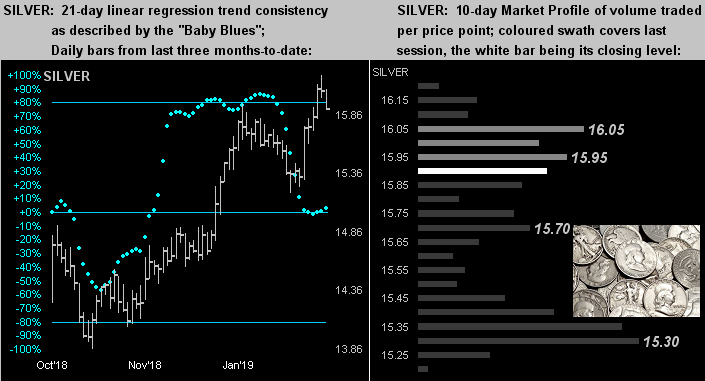
As for Sister Silver, her Baby Blues (below left) haven't had the adroit reversal upward as have those for Gold: rather, hers have simply halted their decline. But per her Profile (below right) she did finally reach the 16s for the first time in over six months (since 13 July) only to stumble a bit in settling out her week at 15.91. Still for you Silver hoarders stacking at home, with the Gold/Silver ratio at 83.1x -- but its millennium-to-date average at 63.9x -- calibrating Silver to that today puts price at 20.69:
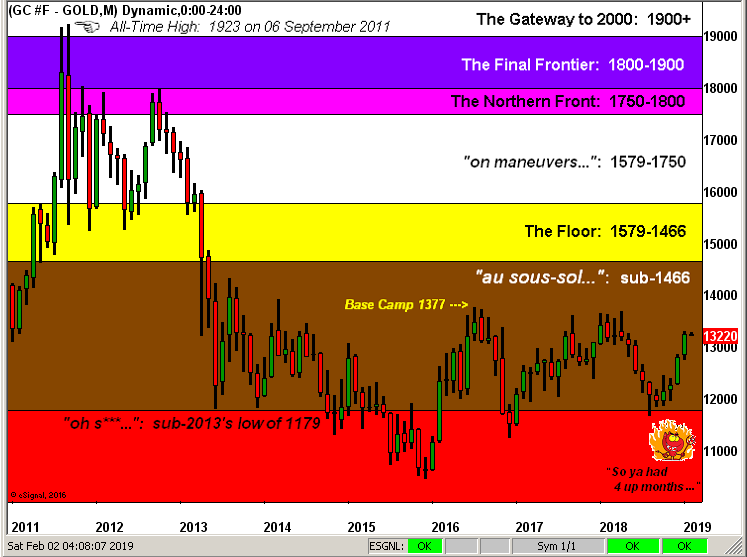
Finally with the turn of the calendar month here is our graphic of the Gold Structure since price's All-Time High all too long ago. We've on occasion quipped that -- unlike most markets -- Gold has a tendency to rise faster than it falls, and the rightmost part of the chart is suggesting such: see those six consecutive red down months? Now look at the subsequent four consecutive up months. Contrary to the wee devil's desire, it looks like we're winning:
In closing, did you read of Russia's stipulation that Venezuela make its end-of-March interest payment in full on time? Said amount due is supposedly in excess of $100,000,000 US. We'll save you the risk of breaking your HP-12C financial calculator on this one: that amount comes to 24,848,800,000,000 Venezuelan Bolívars. Given the country's crisis includes a drastic fall in foreign currency settlings, what are they gonna do? Put all dem Bolívars on a Moscow-bound container ship? Dat's a lotta weight. What if then the ship sinks? Sunken treasure beneath The Pond? Fawgit about it: it ain't worth it. Instead, sink your teeth into some Gold!

Mark Mead Baillie has had an extensive business career beginning in banking and financial services for two years with Banque Nationale de Paris to corporate research for three years at Barclays Bank and then for six years as an analyst and corporate lender with Société Générale.
For the last 22 years he has expanded his financial expertise by creating his own financial services company, de Meadville International, which comprehensively follows his BEGOS complex of markets (Bond/Euro/Gold/Oil/S&P) and the trading of the futures therein. He is recognized within the financial community of demonstrating creative technical skills that surpass industry standards toward making highly informed market assessments and his work is featured in Merrill Lynch Wealth Management client presentations. He has adapted such skills into becoming the popular author each week of the prolific “The Gold Update” and is known in the financial website community as “mmb” and “deMeadville”.
Mr. Baillie holds a BS in Business from the University of Southern California and an MBA in Finance from Golden Gate University.


