Gold's Near-Term Trend Turns Negative


Not that this week's title came without warning per this end-of-day table presented in The Gold Update three weeks ago, Gold having closed back then on 17 April per the red box at 1695.

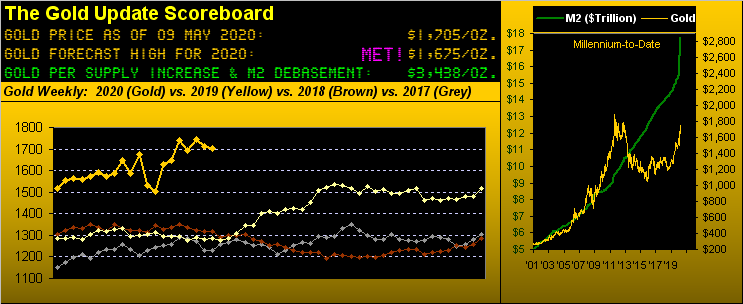
And in fact with all credit due the Gold Bulls, price since then has traded as high (into the time-and-again cited massive overhead resistance) as 1764. But then credit the Gold Bears as well with price reaching down into the 1600s in each of those past three weeks, finally settling yesterday (Friday) at 1705. That is just 30 points above our pre-corona-calculated forecast high for this year of 1675.
Since having presented that table three weeks back -- now include the inexorable passage of time -- and Gold's 21-day linear regression trend officially this past Wednesday rotated from positive to negative. Yes, Gold today merely by the Scoreboard's Dollar debasement value "ought be" at 3438: however the trading community has pushed price to and fro, placing it today at the fundamentally lowly level of 1705. 'Tis what 'tis.
And graphically, here's how it all looks. Follows are the last 21 trading days (one month) for Gold on the left, Silver at center, and for comparison's sake, the S&P 500 on the right. The respective grey diagonal lines are the actual trends, the baby blues dots depicting the day-to-day consistency of those trends. The dual signals portrayed in the above table from three weeks ago were triggered then by the "Baby Blues" falling below their respective +80% axes. And volatility aside, the S&P has thus far thwarted the negativity and instead bestowed it by conventional contra-trading wisdom upon the precious metals:
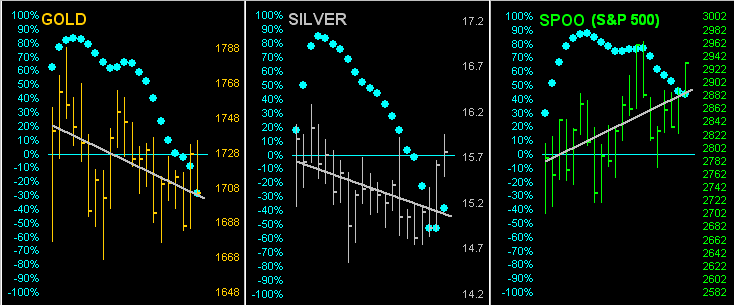
But there may very well be a marvelous silver lining to what we're seeing specifically with respect to the crisis and fear fostered upon us by COVID. Markets have a hankering of being well ahead of public perception. Even in the face of the unconscionable creation of legislative and Fed faux dough, we query: are the prices of Gold and Silver reflective of such fear? No. Is the stock market as represented by the S&P 500 reflective of the economic crisis? No. At least within the vacuum of this technical read, these markets do not appear worried a wit, the precious metals in decline and S&P rising. COVID has caused tragic family torment, and the countering of the virus, horrific economic hardship. But these markets in their cold, focused way apparently are already looking beyond the COVID sorrow as here today, gone tomorrow.
Still that doesn't rule out the precious metals eventually getting their upside grip and the S&P going really over the cliff, well beyond its March low. But 'tis curious (understatement) that such hasn't happened by now. Très curieux, en effet. And moreover, global economies are beginning with judgmental prudence to reopen.
"But mmb, there's so much fresh money now that it's working its way into stocks..."
A very logical observation there indeed, Squire, especially given StateSide interest yields are traipsing upon the zero-to-negative line. "Buy our bonds and give us your interest, or else, buddy!" Cue the late, great Jim Morrison: "Strange days have found us..."[The Doors, '67]
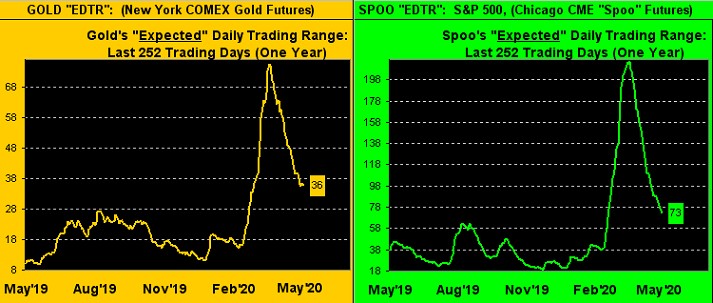
And yet as we first penned five weeks ago, in then noting the improvement in the S&P 500's moneyflow, fear continues to fade from the market, evidenced as well by the ongoing reduction in trading volatility. Here from one year ago-to-date is the "expected daily trading range" for both Gold at left and the S&P at right. To be sure, 'tis still quite rangy out there, but these "EDTRs" have drastically narrowed from where they were in March, in turn bringing some of the excessive trading margin requirements more into line whilst easing cardiac concerns:
Specific to Gold's weekly bars from one year ago-to-date, note the rightmost weeks' compression of higher lows and lower highs, both within the context of the ascending parabolic trend. Traders may refer to this as price's "coiling", ready to spring as the next big thing. We've Gold's negative near-term trend plus overhead resistance versus fundamental logic rooted in printed money persistence. All upon which to keep one's eyes focused:
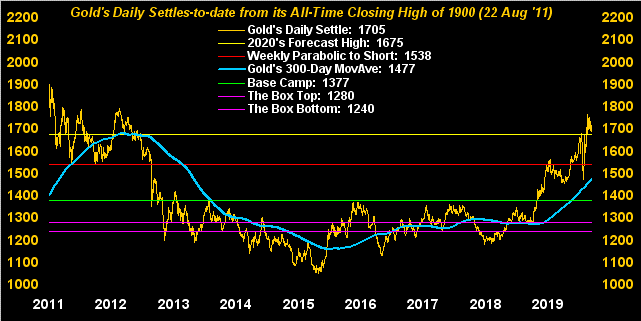
More broadly, here are Gold's daily closing prices since the highest ever at 1900 on 22 August 2011. Obviously per our comparative charts in recent missives, Gold's crossing above 1700 this past 06 April did not have nearly the like "umph" to get it to 1900 in just a mere month as we witnessed back in 2011. But the broad picture is ever so healthy with price well above its 300-day moving average, (some may opine "too well above"). And all that massive overhead resistance of which we regularly note is visible at left during 2011-2012. That notwithstanding, luv, please chat up a Short near you to take the other side of the trade such that price can move up to 2000, and beyond...
'Course, moving to ever lower levels and below is our Economic Barometer as 'tis set upon by the "Teeth of COVID" (in theatres this week). Incoming data reflective of March, April and May shall pound down the Baro into June and July (but hopefully not beyond). Of note, we regularly go on about the Econ Baro leading the S&P (red line) and that the latter need turn toward the level of the former. But in this completely unexpected pandemic case, the S&P rightly was to first to be spooked, rather than await the lagging economic data which eventually leads the market about by the nose. Thus as economies begin to come back on line, this time 'round 'tis the Baro that can move to the graphed level of the S&P ... we'll see. As for the rightmost wee up-hitch by the Baro, 'tis rather meaninglessly reflective of the enormous April Payrolls loss not being as dire by consensus, nor was the Unemployment Rate. Too, Hourly Earnings increased (less folks doing more of the work) and March's Wholesale Inventories (which for you WestPalmBeachers down there is a drag on corporate income) were further reduced beyond February's decline. More than you wanted to know, but it all counts. Here's the resulting Baro:
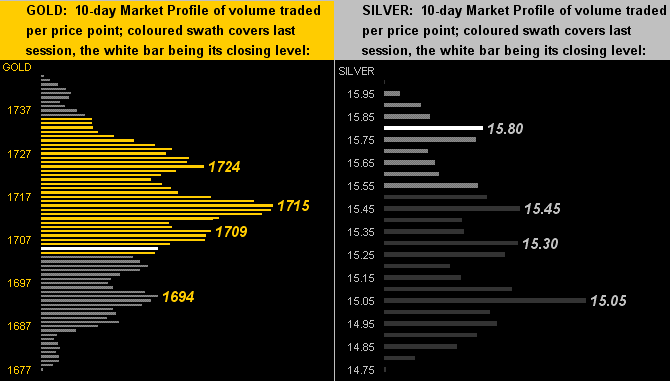
Toward this week's wrap we go to the 10-day Market Profiles for Gold (below left) and Silver (below right). Clearly the white metal had a better week (+4.7%) than did the yellow metal (-0.3%), the Gold/Silver ratio in turn dropping from 113.5x down to 108.1x. Silver herself settled the week at 15.78. If geared to the average Gold/Silver ratio this century of 65.7x, price would instead be 25.95. So cast off that industrial metal jacket, Silver, and don those precious metal pinstripes; for percentage-wise, you've so much farther to grow than Gold! (Sounds like a commercial). Indeed the price of Gold today is 88.6% of its All-Time High; Sister Silver is but 31.7% of hers. Meanwhile, here are their respective profiles across the past fortnight:
Gold's near-term technical trend has now turned negative, but price's broader fundamental foundation is so remarkably positive that we're not expecting too much downside. A week ago we saw the S&P 500 complete the "Golden Ratio" retracement up from the March low; were Gold to reciprocate on the downside from its April high, we'd see 1580 trade. But just as Gold has all that oft-mentioned overhead resistance leading up through The Northern Front (1750-1800), so too has support been built throughout much of the 1600s. And you know what they say: when Gold gets stuck, you back up the truck.
We'll back on out for this week with these three quick headline quips:
■ "BNP warns of 2020 profit fall as crisis wipes out equity trading" -- with full disclosure of it being where we began our banking career back in '78, they still aren't using stops?
■ "Record Retail Trading Could Be Due to Coronavirus-Driven Lack of Gambling Options" -- no wonder we're seeing so much foolish contra-trend trading!
■ "Ferrari tops Detroit Three, Tesla tops all" -- 'tis true, the latter's market cap tops that of the other four combined; but ya can't take away from the Prancing Horse the coolest ticker symbol on the planet, RACE:
So best to race off and mind your Gold, indeed take on more to add to your load in anticipation of levels yet untold!
www.deMeadville.com
www.TheGoldUpdate.com
********

Mark Mead Baillie has had an extensive business career beginning in banking and financial services for two years with Banque Nationale de Paris to corporate research for three years at Barclays Bank and then for six years as an analyst and corporate lender with Société Générale.
For the last 22 years he has expanded his financial expertise by creating his own financial services company, de Meadville International, which comprehensively follows his BEGOS complex of markets (Bond/Euro/Gold/Oil/S&P) and the trading of the futures therein. He is recognized within the financial community of demonstrating creative technical skills that surpass industry standards toward making highly informed market assessments and his work is featured in Merrill Lynch Wealth Management client presentations. He has adapted such skills into becoming the popular author each week of the prolific “The Gold Update” and is known in the financial website community as “mmb” and “deMeadville”.
Mr. Baillie holds a BS in Business from the University of Southern California and an MBA in Finance from Golden Gate University.
More from Gold-Eagle


