Gold's Net Gain Of Nothing


Gold Update
Pop Question! What did the price of Gold just do for the 23rd time in better than eight years since the week ending 20 August 2010? (... crickets ... crickets ... crickets ...)
Oh come on, folks, even Squire likely knows this, wherever he's gone to spend this extended Stateside weekend. (... more crickets ...)
Answer: For the 23rd time since that date, the price of Gold just posted a weekly settle in the 1220s.
What it means: That one ounce Canadian Maple Leaf coin which you dutifully purchased or perhaps found amongst Uncle Filbert's personal effects back in 2010 is still valued today at the same amount of Dollars.
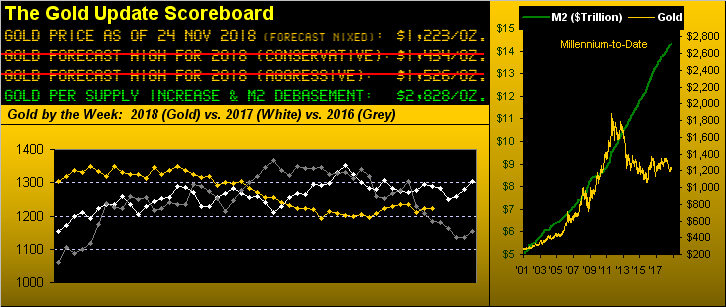
What is not the same amount: Try the supply of Dollars: by the M2 measure, there were $8.66 trillion of 'em as of 20 August 2010; today they amount to $14.29 trillion, (source: St. Louis FRB). The U.S. national debt on that date was $13.38 trillion; this year-end estimation has it at $21.52 trillion, (source The Balance). How about global derivatives as reported by the Bank for International Settlements: (oh rats, our trusty HP-12C doesn't offer enough decimal places to deal with the high-end estimate which exceeds a quadrillion). Heck, even the S&P 500 since that date (at 1072) has been up as much as 174% (to 2941), is presently up 146% (at 2633), and upon completion of our call for a 27% correction (to 2154) will still find it twice as high (+101%) from back then, (the gross domestic product up just 30% en route) ... all of that just in case you're scoring at home, (shrewd thinking given your money manager's voice-mail box likely being full over this measly correction thus far of just 10%).
But you get the point: You've gotten it year-after-year and yet Gold's price on balance is still here. Go figure, (no wait, we just did). As for the 23 weeks of 1220s settles, there was that first one in 2010, followed by one in 2013, and then by four in 2014, three in 2015, four in 2016, five in 2017, and again five year-to-date in 2018. Dizzying.
To be sure, Gold's price throughout has been tradable, reaching as high as we all know to 1923 on 06 September 2011 and then to as low as 1045 on 03 December 2015 ... indeed successfully tradable so long as one has known when to follow which trend and when to fade which trend and when to act by the passage of contract volume and the by passage of trading range and by the passage of time and when to trade and when never to trade and -- as is always paramount -- having prudently managed one's cash along the way.
![]()
"It's so easy it's so easy it's so easy..."
![]()
--(The Crickets, '58).
Fact is, 'tis so easy (should some ask) to simply guess that the price of Gold is around 1220 and you'll likely be right, (put don't push it). Gold certainly didn't push it this past week, settling yesterday (Friday) at 1223, +0.1%. The S&P's week was -3.8%. Oil's was -11.3%. Bits**t's was -22.8%. And as we turn toward Gold's Weekly Bars, the story remains the same as it has been for, well, weeks: price remains entrapped between the bottom of The Box (1240-1280) and the ascending blue dots of parabolic Long trend, the level to flip it all Short now up to 1200 "dead" (to use a little Formula One lingo there). As for the Gold/Silver ratio being at 85.8x? The millennium-to-date median is 63.9x and yet the ratio has been above 80x these past 71 trading days (15 August-to-date), the longest such streak prior to this year being 17 days in 2016. Gone may be the silver-laced film and the silver-filled tooth, yet we still have jewelry, medicines, solar, utensils, electronics, and lest we forget, Silver like Gold is money. Here are the bars:

Speaking of money, that which is funny is exemplary of the descending red line (i.e. the S&P) as we next see, its racing down to get graphically back "in sync" with the still-declining Economic Barometer which itself suffered further brake failure this past week: improved housing data for October was more than mitigated by growth in the lagging measure of Leading Indicators slowing from +0.6% to +0.1% (the Econ Baro already having reflected that) plus a flop in the oft volatile Durable Goods reading from +0.8% to -4.4%. Here's the picture:
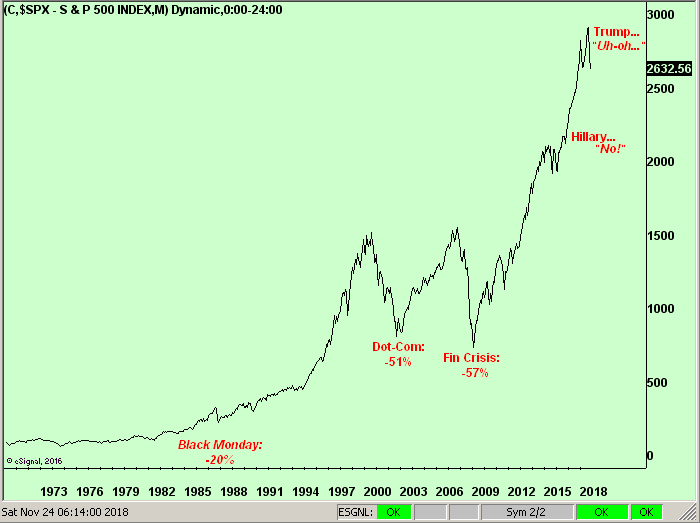
And specific to the stock market, irrespective of the toll on folks' paper-valued dough, 'tis somewhat amusing to witness the erosion of what had otherwise been perma-complancency in the reporting of it all. The "rout continues", they say; "Goldman Sachs (NYSE:GS) is not feeling very bullish about stocks", they say; "stocks again setting up for a tough session", they say. Generational turnover of Wall Street workers and FinMedia reporters has left today's bunch not knowing what a "tough session" is. So let's provide this gentle reminder via the S&P these past 50 years:
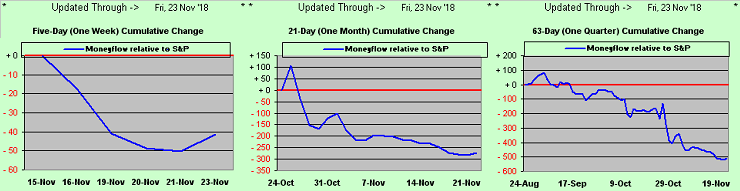
And in the same vein as regards future pain, let's refresh our S&P Moneyflow measurings: across the following three-panel chart we've the difference in the S&P 500's point change versus that of its Moneyflow regressed into S&P points from a week ago, a month ago and a quarter ago. That rightmost panel "suggests" the S&P ought at present be 509 points lower than 'tis, (i.e. at 2121, which is not far from our 2154 correction target). Just sayin'...
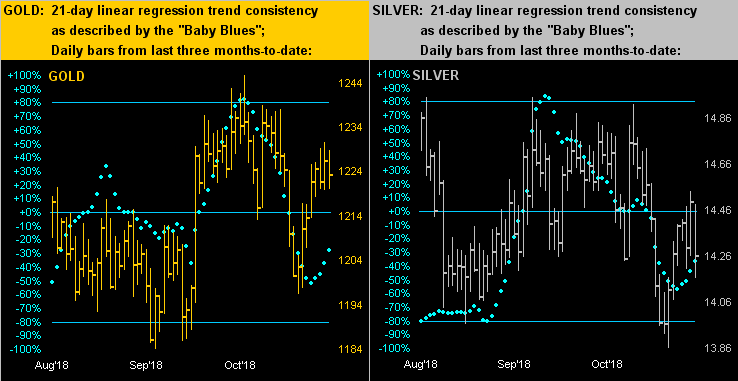
Turning to the daily bars for the precious metals from three months ago-to-date, the scaling of the two panels belies what little alacrity there is in trading range. At present, the "expected daily trading range" (EDTR) for Gold is a wee 11.4 points (just 0.9% or $1,139/contract in risk), whereas for the S&P its EDTR is 50.3 points (1.9% or $2,514/contract in risk) and for Oil 'tis 2.59 points (5.1% or $2,589/contract risk); for the latter two, that's a lot of intra-day risk. But for our two docile precious metals below for Gold on the left and Silver on the right, their like trails of baby blue dots -- whilst tradably oscillative -- still depict that Chris Isaak look of
![]()
"Goin' Nowhere"
![]()
('95):
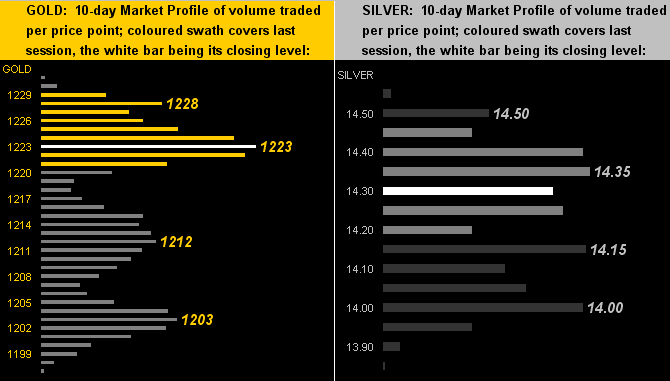
Thus to the 10-day Market Profiles for Gold (below left) and Silver (below right). So much is Gold nested in the 1220s that the week's settle at 1223 is also most commonly-traded price from 09 November-to-date. As for Sister Silver, she's just sittin' in a thicket of so many commonly-traded prices:
Markets have at minimum two sides to every story; there's but one side to every fact, which in this case is that Gold's net change from 20 August 2010 to today is nothing, (i.e. zilch, zero, nada, "unch"), the aforementioned price peregrinations notwithstanding. For as the world continues to unravel from Brexit to Middle East foes to China trade woes to StateSide "oh-No!s" over stocks and migrant flocks, Gold remains tight in its own vein seemingly oblivious to all that ought be driving price higher, the most significant oversight being the ever-upward glide in the M2 money supply as shown in our opening Gold Scoreboard. And yet awaitin' in the wings is the throng's daunting dash to garner cash upon it all going wrong: so mind your Gold and stay strong!
*********

Mark Mead Baillie has had an extensive business career beginning in banking and financial services for two years with Banque Nationale de Paris to corporate research for three years at Barclays Bank and then for six years as an analyst and corporate lender with Société Générale.
For the last 22 years he has expanded his financial expertise by creating his own financial services company, de Meadville International, which comprehensively follows his BEGOS complex of markets (Bond/Euro/Gold/Oil/S&P) and the trading of the futures therein. He is recognized within the financial community of demonstrating creative technical skills that surpass industry standards toward making highly informed market assessments and his work is featured in Merrill Lynch Wealth Management client presentations. He has adapted such skills into becoming the popular author each week of the prolific “The Gold Update” and is known in the financial website community as “mmb” and “deMeadville”.
Mr. Baillie holds a BS in Business from the University of Southern California and an MBA in Finance from Golden Gate University.


