Gold's Next Move Up Will Be Spectacular


Last week's trading saw gold forming its low in mid-week trading, here doing so with Wednesday's tag of the 1576.00 figure. From there, a sharp rally was seen into Friday, with the metal running all the way up to a peak of 1652.80 - also ending the week at or near the high-end of the range.
Cycles In Crosscurrent
From my comments made in past articles, the bigger picture assessment for gold is that the metal is headed higher into the Autumn of this year - with the potential for that move to reach up to the 2000 level before peaking. The larger uptrend comes from the largest cycle that we track, the four-year wave, shown again below:
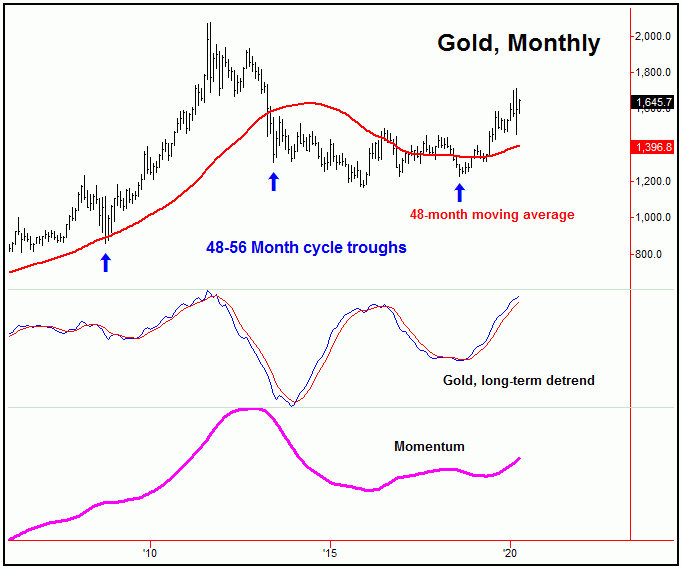
On our four-year chart, we can see that both the momentum and the long-term detrend indicator (which is also a measure of momentum) are pointing higher at the present time. This is seen as decidedly bullish, at least until otherwise reversed, with this four-year wave only 20 months along from its prior bottom. In a larger bullish phase, peaks tend to hold off until the 30 month mark or longer.
Having said the above, the problem with the mid-term picture is that several of our key time cycles are seen as pushing lower in the coming weeks - which should keep any near-term rallies in check. Eventually, however, these cycles will trough - leading to what should be a spectacular push higher into later this year - once again with the 2000 level acting as the magnet for that rally.
Here is one of the medium-term waves, the 154-day cycle:
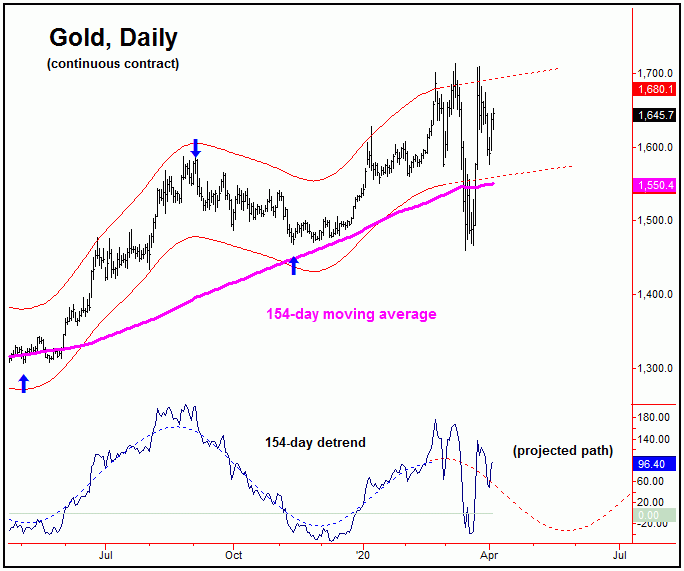
As we can see on the chart above, the detrend indicator is projecting lower prices - or at least sideways-to-down action - in the next month or so. As mentioned, this should limit the amount of upside with price in-between.
The major cycle above the 154-day component is one which we noted several times earlier this year, the 310-day wave - which is shown on our next chart:
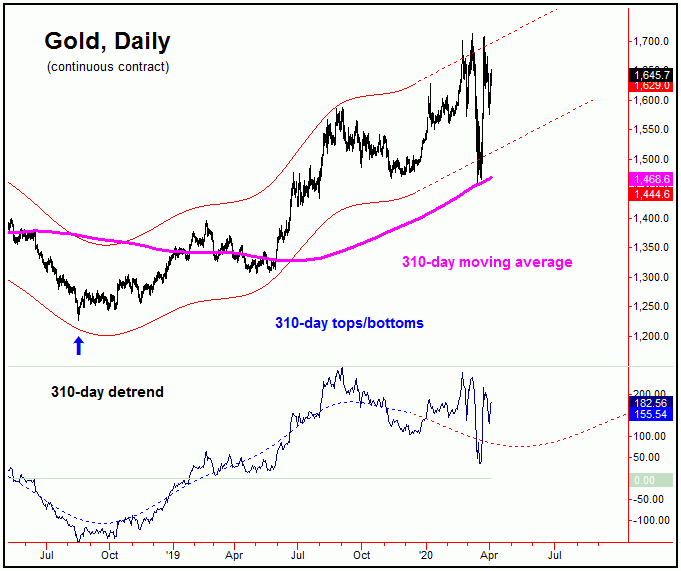
The above chart shows the 310-day detrend projecting a bottom in the next month or so, which should also bottom the smaller 154-day wave. Once this combination low is complete, a major multi-month rally should unfold - taking prices sharply higher into later this year.
With the above said and noted, we have two key dates of focus where the next semi-important bottom should occur, with the precise details noted in our thrice-weekly Gold Wave Trader market report.
All said then, gold is currently in the process of building a base for the next larger rally phase, which should be a spectacular move higher - once the mid-term waves do bottom. The move higher could easily overshoot the round-2000 mark, as I could well be conservative in my expectations on how the next move up will play out.
Gold, Shorter-Term
From the comments made in recent articles, the smallest tracked wave - the 10-day cycle - has been dominating the action. Here again is that 10-day wave:
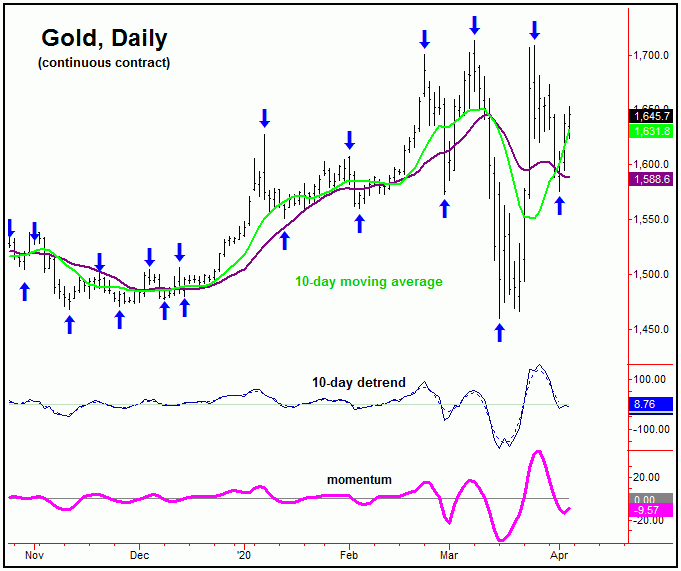
From last weekend: "the 10-day cycle is now dominating the short-term action, with this wave last topping with the tag of the 1699.30 figure on Wednesday - and with that is heading lower at the present time. Its next bottom is due to materialize this week, with the same now favored to end up as countertrend - against the 1460.00 figure, the prior labeled low for this component."
As mentioned above, the 10-day wave was seen as pushing down into early last week, where its next bottom was expected to form. In our Gold Wave Trader report, we noted March 31st, plus or minus a day in either direction, as the expected low for this wave. That decline stopped right on schedule, made on Wednesday, April 1st with the tag of the 1576.00 figure (June, 2020 contract).
In terms of price with the above, following my rule with cycles and moving averages, a decline back to the 10-day moving average was expected to play out on the recent correction phase of the 10-day wave, though with that decline expected to end up as a countertrend affair - due to the recent turn up in breadth.
With the above, we were able to buy into Wednesday's early weakness, going long the GLD right at the 10-day moving average - then around the 1587 figure for gold. From there, we were able to exit into the sharp rally that was seen into Thursday's session, taking an exit on our GLD position, for what was a very nice one-day again (around the 1639 figure for gold).
As for our 10-day wave, that cycle is still seen as pointing higher at the present time, with its next peak due again in the coming days. That peak is expected to give way to a larger percentage decline on the next downward phase of this wave. The next short-term low could prove to be a very important one, once again with the exact details of how this decline should play out noted in our Gold Wave Trader report.
U.S. Stock Market, Mid-Term
Last weekend I promised an update on the mid-term cycles that we track, which have been responsible for the sharp weakness seen since the mid-February price peak. Here is the 180-day cycle, which is the most dominant mid-term wave:
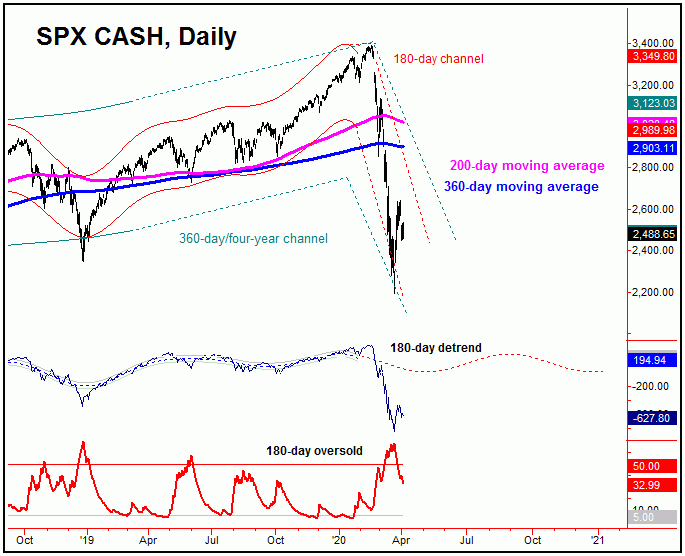
In eyeballing the above chart, we can see that our detrend indicator is projecting lower prices for the coming months, ideally looking for a mid-year time/price trough. If that is correct, then any short-term rallies should be expected to end up as countertrend, with the most recent rally coming from the smaller 45-day wave, shown on our next chart:
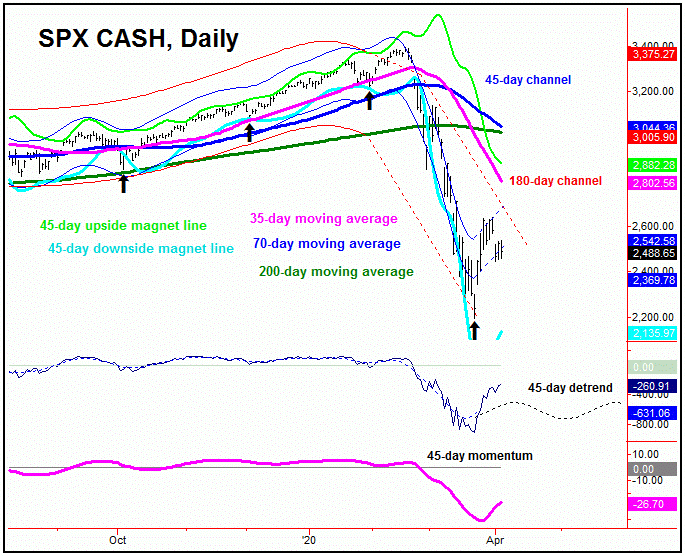
The chart above has the 45-day wave pointing higher off the March 23rd bottom of 2191.86 on the SPX CASH index, ideally heading up into the mid-April timeframe. In terms of price, it may well be that the actual peak for this wave was made with the recent tag of the 2641.39 figure. Having said that, since the 35-day moving average will normally act as a magnet to the upward phase of this wave, the assumption is that a move back to this key moving average will be seen in the coming weeks.
In terms of patterns, however, the upward phase of this 45-day wave is expected to end up as a left-translated, countertrend affair. If correct, what eventually follows should be a drop back to lower lows for the larger swing, before bottoming the larger 180-day cycle - for what is anticipated to be a multi-month rally phase into later this year. More on all as we continue to move forward.
Jim Curry
The Gold Wave Trader
http://goldwavetrader.com/
http://cyclewave.homestead.com/


