Gold's Price Up Streak Completes Its 24th Week


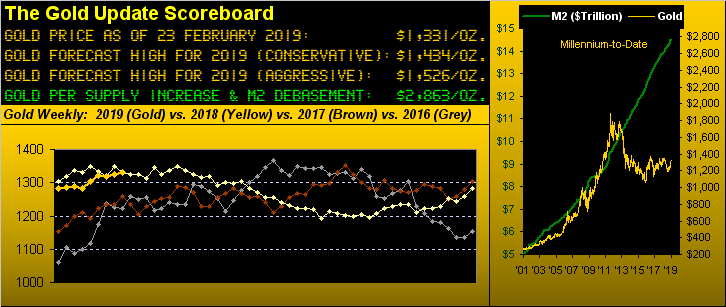
Mind you that Gold on this run has not recorded 24 consecutive up weeks: indeed seven of them have been down. But the overall weekly parabolic Long trend is now up for the 24th straight week. And as you regular readers know, that's sayin' something.
Indeed along with those of you lucky enough these many weeks to have been scoring at home, Gold now stands alone in having recorded its third-longest weekly parabolic Long trend since the commencement of this Third Millennium back on 01 January 2001. However as pointed out in recent missives, this one -- at least to date -- hasn't produced as much intra-trend upside punch as have the only other two which have bettered it ... but 'tisn't bad. And if you've missed out on scoring, here are the top three:
■ 26 weeks during 2005 from 27 June through 23 December: first price 441.0, last price 505.2 (net gain 14.6%); intra-trend low 418.2 to intra-trend high 544.5 (gain 30.2%);
■ 25 weeks during 2004 from 12 July through 31 December: first price 408.2, last price 438.4 (net gain 7.4%); intra-trend low 385.0 to intra-trend high 456.5 (gain 18.6%);
■ 24 weeks completed since 18 September 2018: first price 1199.8, current price 1330.7 (net gain 10.9%); intra-trend low 1184.3 to intra-trend high 1349.8 (gain 14.0%).
As for you miners followers across the same current stint, GDX (the VanEck Vectors Gold Miners exchange-traded fund) has traded as low as 17.58 to as high as 23.70, an intra-trend gain of 34.8% and more than double that by the yellow metal itself. So quit yer bitchin' and keep on pitchin'.
'Course the longer the parabolic Long trend runs, the tighter becomes the squeeze by the ascending blue dots as we see here in the graphic of Gold's weekly bars. (It does look fairly impressive, one has to say). Yet price settled out the week yesterday (Friday) at 1331 to net only a six-point gain, the parabolic flip-to-Short level rising ten points from 1300 a week ago to 1310 now. Further as you can see by the closing nub on the right-most bar, Gold gave up most of its intra-week gain, whereas for the prior four weeks price settled near each respective high. Certainly the squeeze is on, and given that Gold's trading range is once again widening, the rising parabolic becomes more threatening:

Indeed Gold's EDTR (expected daily trading range) is expanding as we next see here in the daily chart of EDTRs from one year ago-to-date; (again this is expected range, not price's track). Now at 12.4 points as shown in the box, that is a 25% increase in volatility from the 9.9 points "low" from just two weeks ago:
Moreover, the expected weekly trading range is now 23.9 points, more than enough to conclude the aforeshown 24-week parabolic Long trend as the distance to the blue dot is just 21 points.
As usual, such streak is oblivious to both the FinMedia and the trading public at large: the big focus there is that the "Dow" (aka that Index at which our parents look) has risen for nine straight weeks, the intra-trend gain therein being a full, fat 20.0%. But obviously that has not thwarted one wit Gold's more time-enduring streak which continues along in positive correlation with the stock market. Our benchmark for stocks being the S&P 500, here is its percentage track for the last month (21 trading days) along with that for Gold, the two somewhat reminiscent of their romantic "pas de deux" days we've oft cited over the years:
However: that which is most important about the stock market you're likely not hearing, perhaps because the mathematical effort required nobody is doing, ('cept us as 'tis our wont). Indeed if you've stock market exposure, this next two-panel graphic ought rightly give you a fair scare. The left-hand panel may appear familiar to regular readers and/or frequenters to the website's S&P 500 Moneyflow page: in this case from a month ago-to-date, the blue line is the difference between the points change in the S&P and its Moneyflow regressed into S&P points, the latter being unsupportive of the former. Which brings us to the right-hand panel we've rarely showed: the red line is the rising S&P across the same one month time span ... and the blue line is the amount of money it takes to move the S&P one point. Thus the higher the S&P has climbed, the less amount of money is making go. Uh-oh. You've heard of Frosty the Snowman? We're anticipating Frothy the Avalanche:

Moreover, Q4 Earnings Season is nearly complete for the S&P. And for the 425 components having reported, 72% have done better than in the like period a year ago ... but for each of Q1, Q2 and Q3, 85% did better. Thus earnings improvement clearly is slowing down and our "live" price/earnings ratio for the S&P is an earnings-unsustainable 28.9x. Have a nice day ... and may the correction to S&P 2154 continue.
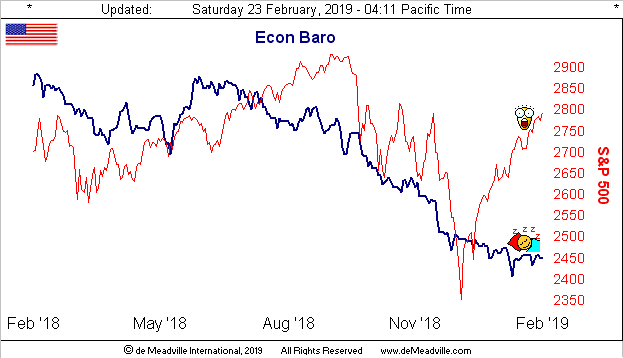
Having had a sleepy set of days through the week just past is the Economic Barometer, with just six metrics of input. The National Association of Home Builders Housing Index recorded surprisingly robust February data; but the month's Philadelphia Fed Index reversed into negative territory as did the Conference Board's reading on January's Leading Indicators (which are "lagging" for you ahead-of-the-curve Econ Baro fans), their shrinking with a -0.1% result. Here's the output:
Still, despite the above truths, we're told that Americans are the most financially optimistic they've been in some 16 years and are as upbeat as ever about retirement. But according to NerdWallet: "For households headed by someone age 75 or older, the median value of retirement holdings is $120,000, with an average holding of $336,500." 'Course the average is skewed well above the median by all those evil rich people out there that are in the crosshairs of the bazillion or so Democrat candidates running for President next year. But let's say you're right at that $120,000 median, (which for you West Palm Beachers down there is the mid-point of all the retirement holdings). Safely invested at 3% per annum, that yields you $7,200/year, i.e. $600/month. But don't forget your Social Security check, for which according to Investopedia "...the estimated average monthly benefit for 'all retired workers' in 2019 is $1,461..." So let's do the math: $600 + $1,461 = $2,061 of monthly income. Good luck. And when the money runs out either at home and/or for the entirety of the Social Security Trust Fund, the requisite monetary printing to keep us oldsters upright shall skew the price of Gold up into the stratosphere.
Speaking of Gold here is our two-panel chart of the yellow metal on the left for its daily bars of the past three months-to-date along with the baby blue dots of linear regression trend consistency -- or of late lack thereof -- with same for the white metal on the right. As we've been so fervently detailing, Gold has had a terrific run, indeed this past week tapping 1349, a mere 28 points away from the critical upside target at Base Camp 1377. But we have to think the "Baby Blues" are suggestive of the precious metals getting a case of the blues such that Gold's parabolic Long trend now 24 weeks old shall likely soon fold:

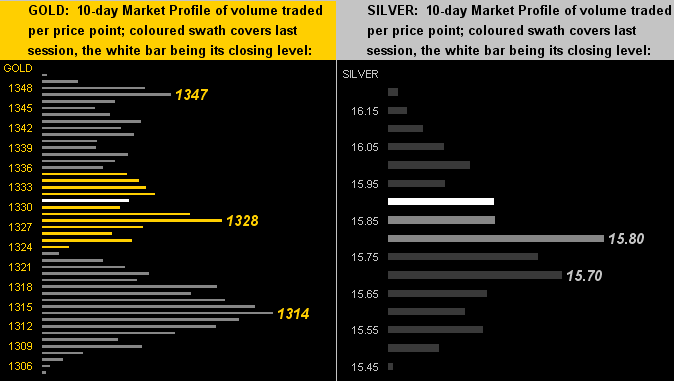
All that said and as depicted in our missive of a week ago, there's been a reluctance to sell Gold, although as noted earlier, this past week was the first of the past five wherein price closed nearer to the week's low than to its high. And in turning to the respective 10-day Market Profiles for Gold (below left) and Silver (below right) denoted with their most dominantly-traded prices, the picture is taking on more of a notion of fits and starts (to which the trader might add the word "stops" as well):
Meant solely in the spirit of good-natured humour, let's close with this. You fans of Barron's may be familiar with one of their budding reporters whose pieces have been rising to the top of the Dow Wires stack. Evie Liu, also an honoured alumna from our alma mater U$C, has developed the valued knack that most of us lack: that of being able to link precise changes in the "Dow" to a specific event. 'Tis quite extraordinary, indeed so much so that one considers scrapping the balance of all other financial knowledge both fundamental and technical. Here are four Evie headlines from this past holiday-shortened week:
■ "The Dow Finishes Flat Because All the Good News Is Priced In"
■ "The Dow Rises 63 Points Because the Fed Minutes Came and Went"
■ "The Dow Drops 104 Points Because Trade Talks Aren’t Enough"
■ "The Dow Rises 181 Points Because a Trump-Xi Meeting Just Might Happen"
Wow! What else do we need to know, eh? Evie clearly is cornering the entire FinMedia complex. Now if we can just get Evie on Gold, we'll have the whole package!

Mark Mead Baillie has had an extensive business career beginning in banking and financial services for two years with Banque Nationale de Paris to corporate research for three years at Barclays Bank and then for six years as an analyst and corporate lender with Société Générale.
For the last 22 years he has expanded his financial expertise by creating his own financial services company, de Meadville International, which comprehensively follows his BEGOS complex of markets (Bond/Euro/Gold/Oil/S&P) and the trading of the futures therein. He is recognized within the financial community of demonstrating creative technical skills that surpass industry standards toward making highly informed market assessments and his work is featured in Merrill Lynch Wealth Management client presentations. He has adapted such skills into becoming the popular author each week of the prolific “The Gold Update” and is known in the financial website community as “mmb” and “deMeadville”.
Mr. Baillie holds a BS in Business from the University of Southern California and an MBA in Finance from Golden Gate University.


