Gold's Rally Complete - U.S. Stocks Heading for Larger Low


 Recapping Last Week
Last week's action once again saw Gold forming its low in Wednesday's session, here doing so with the tag of the 1745.40 figure. From there, a sharp rally was seen into early-day Friday, with the metal running all the way up to a peak of 1782.40 - before selling down off the same into the daily/weekly close.
Gold, Short-Term
For the very near-term view, as mentioned last weekend another short-term rally was in force for the Gold market, with that rally coming from the smaller-degree 10 and 20-day cycles - with the larger 20-day wave shown below:
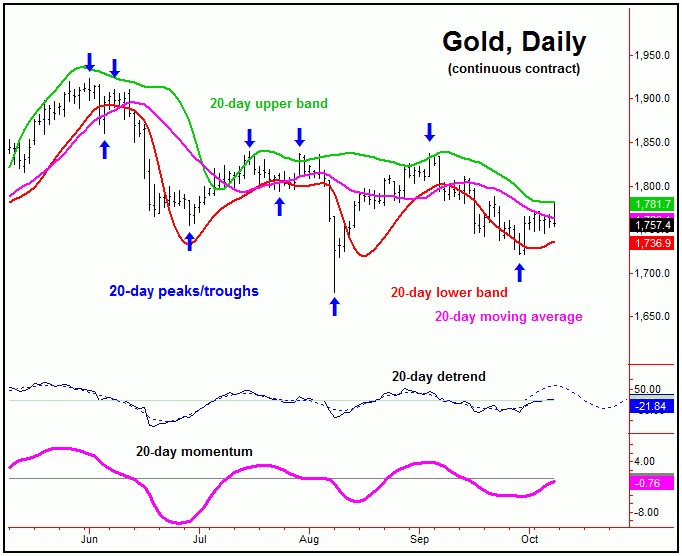
From last weekend: "the ideal path is looking for additional strength in the coming days, though the overall move up is favored to end up as a countertrend affair, due to the position of the larger 72 and 154-day cycles. Going further, a countertrend rally for Gold means one that remains below the 1836.90 swing top."
With the action seen into last week, we got our expected higher high for the minor swing up - with prices also rallying back to the 20-day moving average. In terms of patterns, however, as mentioned, the probabilities favored the move up to end up as a countertrend affair - due to the position of the larger 72 and 154-day waves.
From last weekend: "until a lower level materializes, any reversal back above the 1836.90 swing top would be our indication that the 72 and 154-day cycles have bottomed. With that, as mentioned, the overall assumption is that the rally phase of the short-term waves will remain below that key figure, with resistance to the current swing up being the 1785-1800 level for Gold."
As noted above, the 1785-1800 region was noted as resistance for the last swing up, with the actual high coming in at the 1782.40 figure. This was right in line with our expectation for a countertrend rally, which now looks to be complete with Friday's early-day high. If correct, then our ideal path is looking for weakness overall into later this month or beyond, before setting up the next larger swing low.
Going further with the above, the next key bottom for Gold should come from the combination of 72 and 154-day cycles, with the larger 154-day component shown again on the chart below:
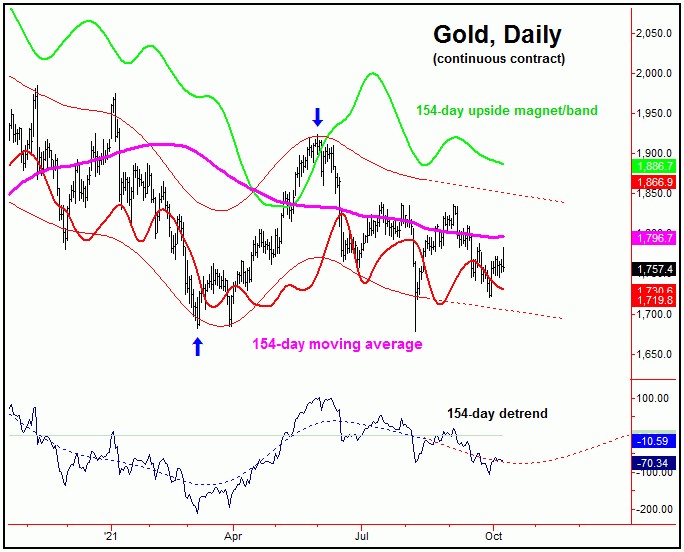
In terms of time, our 72 and 154-day cycles have been projected lower into the late- October to early-November timeframe. In terms of price action, due to momentum considerations, the probabilities now lean in favor of the 1677 swing bottom to end up as the actual price low for this 154-day wave.
Even with the above, additional weakness is now expected in the days/weeks ahead, before another key trough forms. From whatever bottom that is made going forward, the probabilities will favor a sharp rally into early next year, with the upper 154-day cycle band acting as the ideal price magnet into early next year.
U.S. Stock Market Update
It's been awhile since we have looked at the U.S. stock market. The last time we did an analysis of the SPX (the S&P 500 index), the index was seen as being in the process of forming a mid-term peak:
From my 8/15/21 article: "In taking a look at the U.S. stock market - as measured by the S&P 500 index, or 'SPX' - this market is still in the process of forming a mid-term top. That top is expected to come from the combination of the 180 and 360-day cycles. Once this 360-day cycle does top out, the largest decline of the year is likely to follow, with mid-term support around the 200-day moving average on the SPX, if tested."
As mentioned back in August, the SPX was setting up for its largest percentage decline of this year, with that decline expected to come from the combination of the 180 and 360-day cycles. The chart below shows the smaller 180-day component:
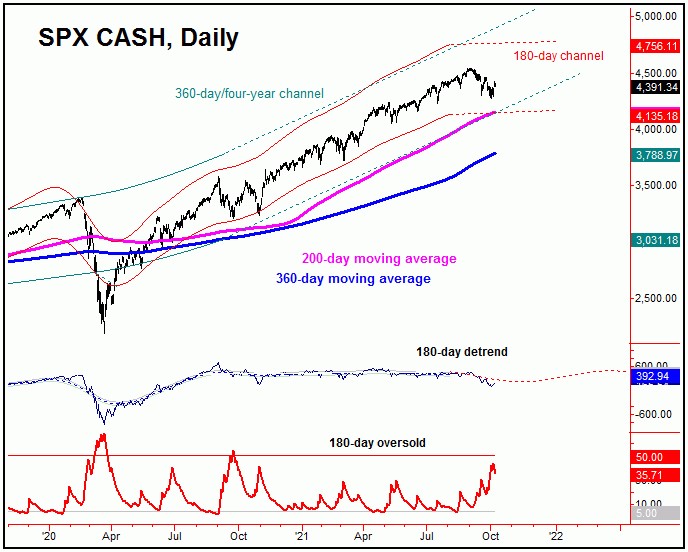
With the action seen over the past month or so, the SPX has indeed seen its largest percentage decline of this year - something in the neighborhood of 6% off the top into last Monday's 4278.94 swing low. Having said that, due to the position of this 180-day cycle, there could be more to come in the days/weeks ahead.
Projected Top Date Nails the Peak
As mentioned in my August update on the U.S. stock market, we had a key projected topping date that was coming due. Take a look at the chart below:
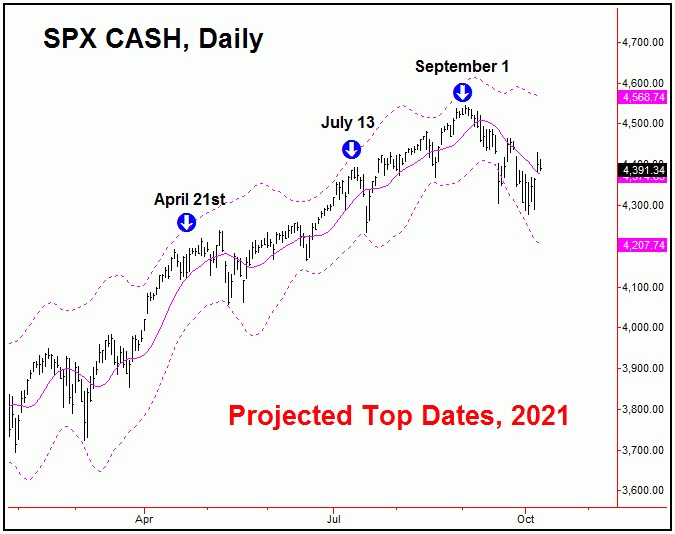
From my 8/15/21 article: "our next key topping date is coming up soon - with the precise details noted in the daily version of our Market Turns report. This upcoming turn date does have the potential to peak our extended 360-day time cycle, though time will obviously tell as to whether this ends up as correct."
Our projected top date was noted in our Market Turns report as being September 1st of this year, and was mentioned several weeks before-the-fact. The actual peak came in on September 2nd - within just one trading day of this projected top date.
Our prior top date was noted for July 13th, which was also within one trading day of the July 14th peak in U.S. stocks. Following each of the three projected key topping dates for the SPX, significant declines obviously followed - with the most current one coming from the aforementioned 180 and 360-day time cycles.
With the above said and noted, while there is at least some potential that our mid-term trough has already formed (simply based upon market technicals), the more ideal path is looking for additional weakness in the coming days/weeks, with the 200-day moving average acting as both a magnet - and as a key support level.
Going further with the above, if lower lows are still out there, we have identified a key bottoming date range, which has the highest-odds for the next mid-term low with U.S. stocks to form. More precise details noted in the daily version of our Market Turns report - which covers the S&P 500 index.
Once the next mid-term trough does form with the SPX, we are expecting another larger-degree rally phase to play out in the months to follow, with that rally being at least 20% or more off the lows - and lasting well into next year. From there, we are looking for the next larger-degree peak to form, coming from the bigger four-year wave.
The Bottom Line
The overall bottom line is that both Gold - and U.S. stocks - are looking for key lows in the coming weeks. Once complete, each of these markets is expected to give way to significant rallies in the weeks/months to follow, with Gold expected to push higher into early next year - and U.S. stocks holding up into the latter part of 2022. More on all as we continue to move forward.
Jim Curry
The Gold Wave Trader
http://goldwavetrader.com/
http://cyclewave.homestead.com/
********
More from Gold-Eagle


