Gold's Short-Term Rally Phase Back In Force


 Recap of Last Week
Last week's action saw Gold holding weaker into Wednesday's session, with the metal dropping all the way down to a low of 1721.10. From there, however, a sharp reversal to the upside was seen into Friday, here running all the way up to a peak of 1765.20 - before backing slightly off the same to end the week.
Gold Market, Short-Term
For the near-term picture, as noted last weekend another short-term low was due to materialize for Gold, coming again as the result of the 10-day cycle, shown below:
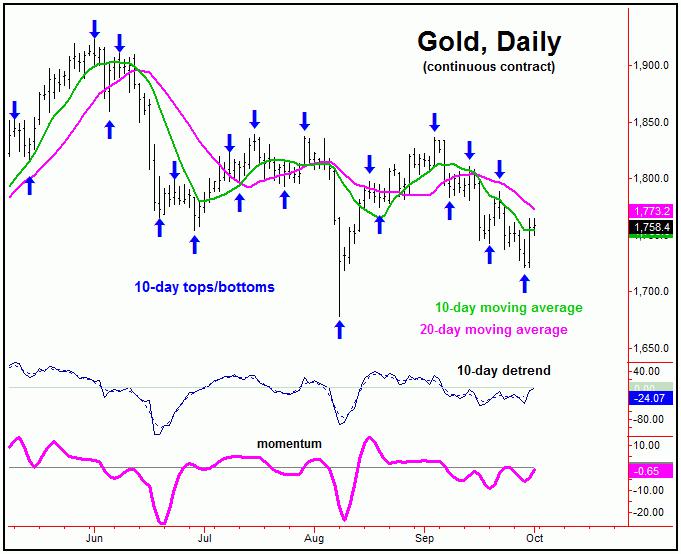
From last weekend: "when a cycle fails to make a tag of its moving average, the market will often make another attempt at the same. With that, we may be nearing another short-term low and bounce phase with Gold."
As mentioned last weekend, since no tag of the 20-day moving average was seen on the prior swing up (into the 9/22 peak), the probabilities favored a short-term bottom forming (coming from the 10-day wave), and then yet another try at the higher 20-day moving average on the next swing up - which we are now in.
Going further with the above, very early in Thursday's session we were able to confirm this short-term bottom in place, doing so with a special e-mail alert. With that, the ideal path is looking for additional strength in the coming days, though the overall move up is favored to end up as a countertrend affair, due to the position of the larger 72 and 154-day cycles, with the smaller 72-day wave shown below:
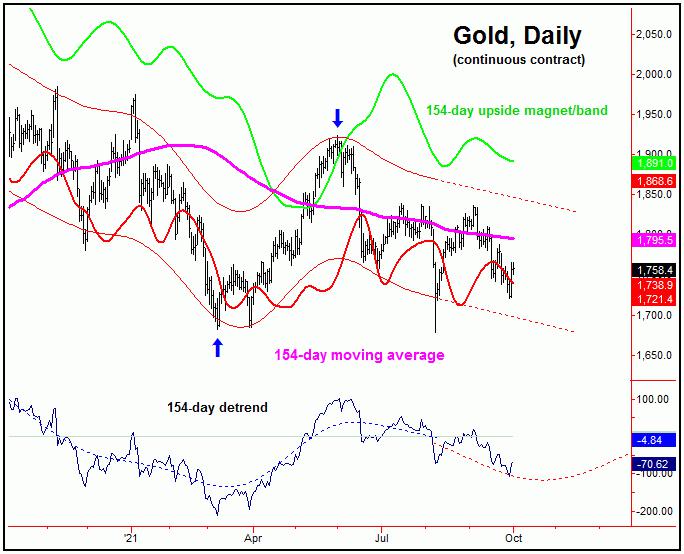
Going further with the above, a countertrend rally for Gold means one that remains below the 1836.90 swing top. If seen, then the next short-term downward phase (i.e., 10 and 20-day cycles) should be favored to give way to lower lows into the late-October to early-November timeframe - which is the ideal bottoming zone for the larger 72 and 154-day cycles. Here again is the larger 154-day component:
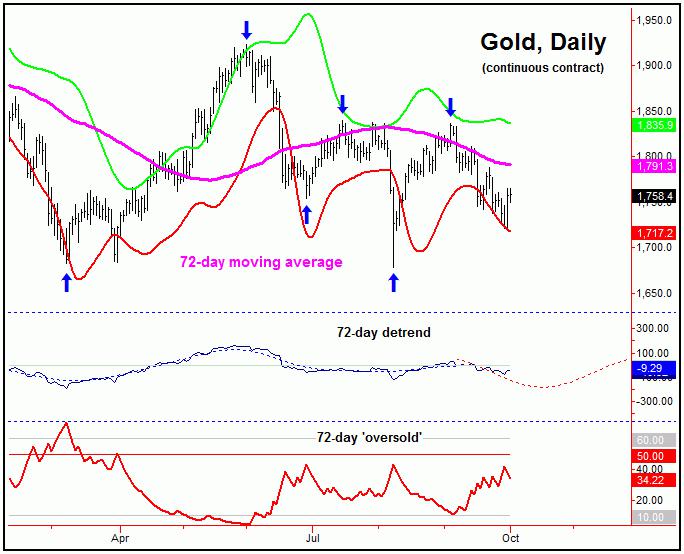
Otherwise, until a lower level materializes, any reversal back above the 1836.90 swing top would be our indication that the 72 and 154-day cycles have bottomed. With that, as mentioned, the overall assumption is that the current rally phase of the short-term waves will remain below that key figure, with resistance to the current swing up being the 1785-1800 level for Gold.
Stepping back, lower lows into late-October to early-November - if seen as expected - would be the ideal spot to be on the lookout for the 72 and 154-day waves to bottom. At that time, we could see our 72-day 'oversold' indicator spiking back above its upper reference line, something seen closer to mid-term bottoms with the metal. We will also be on the lookout for any supporting technical evidence, should that be seen.
For the mid-term picture, as mentioned in past reports, from whatever low that does end up forming with the larger 72 and 154-day cycles, the probabilities will favor a sharp rally playing out into what looks to be early next year. That rally should be somewhere in the neighborhood of 20% off the lows, which is the statistical average rally for the larger 154-day component. More as we continue to move forward.
Jim Curry
The Gold Wave Trader
http://goldwavetrader.com/
http://cyclewave.homestead.com/
********


