"Gold's Upstream Gleam"


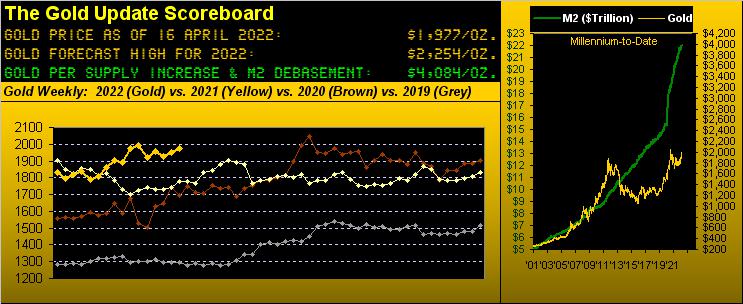
Gold's settling out the abbreviated trading week this past Thursday at 1977 was the yellow metal's second-highest year-to-date weekly close, bettered only by that ending 11 March at 1992.
Better indeed, as it occurred within Gold's weekly parabolic trend being Short, but defied by price now for two weeks running. Yes, as we've oft quipped over these many years, "Shorting Gold is a bad idea" especially when price gaps up over Smart Alec's Short stop as periodically happens toward wrecking his account, (see 19.Mar.2009, 16.Mar.2020, 28.Feb.2022, et alia).
"Jeepers, mmb, that's 118 points of opening up gaps for those three days alone..."
That's why 'tis a bad idea, Squire. And we can wax far more eloquently thereto (like 631 points of up gaps from just 37 days this century ... but we digress). Instead, let us process to Gold's weekly bars from one year ago-to-date. And like salmon spawning upstream against onrushing water, we see Gold rising toward the descending red dots of parabolic Short trend. Fairly gleaming stuff, one has to say:

To be sure, 'twould be imprudent not to acknowledge said trend as Short. However, to see it proved wrong-- such that we can get on toward attaining our forecast high for this year of 2254 per the dashed top line -- is the far better and broader story.
Geo-politically anew, musings of a "NucWpn", loss of a "towed" warship (by either a "stormy sea" else a "missile spree") can be rationale for Gold again getting a boost, and in turn, the S&P 500 being given the boot; (yet, we reprise the infamous headline: "World Ends, Dow +2"). Either way, we'd prefer to see "Gold is on the move" due instead to the debased StateSide money supply, its "M2" measure of which in the new week ought surpass the $22 trillion level to have doubled in eight years.
And yet: Gold's price is only 1977? The market is never wrong, but the irrationality of price today not trading 'round the 4000s is off the far end of Gaussian's bell curve.
All that noted, a favourite measure of ours for detecting if a market is "in play" is the directional change of its "expected daily trading range". Here below 'tis for Gold from one year ago-to-date, clearly of late in "El Plungo" form as range (rather than staying geo-politically hyped) returns toward "normal" levels from well before events related RUS/UKR 2022. Thus we've the nauseating interpretation that Gold at present is not "in play" despite ours (and everyone's) common sense thinking that both range and price ought be "up, up and away":
"Still, price has been up almost as much as 14% so far this year, mmb..."
True enough, Squire. And at 1977 today, Gold at present is +8% net in 2022. Should that be maintained, Gold shall record its seventh-best "year-through-April" percentage gain from 2001-to-date: not really that great given the war, inflation/stagflation, debasement and thus massive undervaluation. Comparably in 2006, Gold's Jan-Apr gain was a net +26%, and 'twas +22% for the like four months in 2016. Yet as just itemized, there are far more "dire" events afoot now than there were back then. But again, in the words of charter Gold Update reader JGS: "One day we'll wake up and Gold'll be 1,000 points higher than the day before." For the sake of humanity, 'tis probably better we never see that. Rather, to get Gold's gains realigned with StateSide currency debasement as we witnessed throughout this century's first decade would be perfectly acceptable, per this magnified 10-year snippet from our opening Gold Scoreboard graphic:
Meanwhile economically off the Dow Jones Newswires this past week came "After Rapid Recovery, Watch for Sudden Slowdown..." Per the Economic Barometer, the lads are having difficulty parsing it all out:
Our best guess is in reference to Q4 Gross Domestic Product annualized growth having been recently finalized at 6.9% (with a blind eye to the 7.1% Chain Deflator, i.e. "real" economic shrinkage). That said, the Baro did put in a good week: April's University of Michigan Sentiment Survey and New York State Empire Index posted improvements, as did March's Retail Sales (save for cars) and Capacity Utilization. However, this all came amidst further inflation in both Export and Import Prices, Wholesale and Retail Inflation, (albeit the Core reading of the Consumer Price Index actually slowed). As well, the U.S. Treasury reduced some of its budget deficit. But February's Business Inventories became more bloated.
Then there's the Federal Reserve with just 13 trading days left until they again raise. And as noted a week ago, the FedFundsFutures already have "priced-in" a 50-basis-point increase come 04 May. Indeed St. Louis FedPrez James "Bullish" Bullard, NY FedPrez John "It's All Good" Williams, and FedGov Christopher "Up The" Waller all see a 50-bps hike in the cards. Besides, they gotta keep up with The Reserve Bank of New Zealand and The Bank of Canada, both having already so moved.
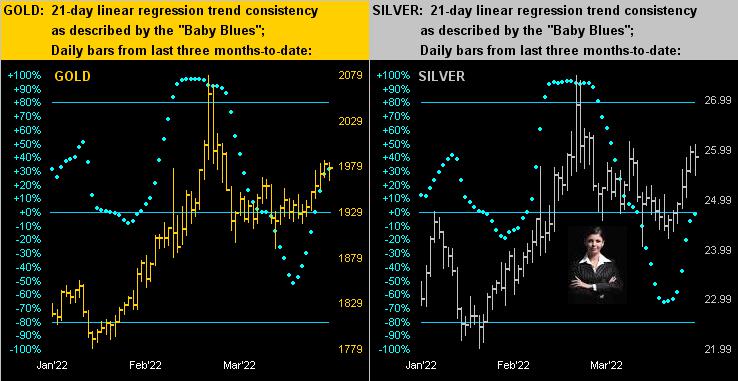
Upwardly mobile as well are the precious metals' "Baby Blues", the dots that depict linear regression trend consistency. Below on the left we've Gold's daily bars from three months ago-to-date, the blue dots clearly in ascent, as they are on the right for Silver. As noted of late, the two charts being ever so similar is indicative of Sister Silver adorned not in her industrial metal jacket, but rather in her precious metal pinstripes:
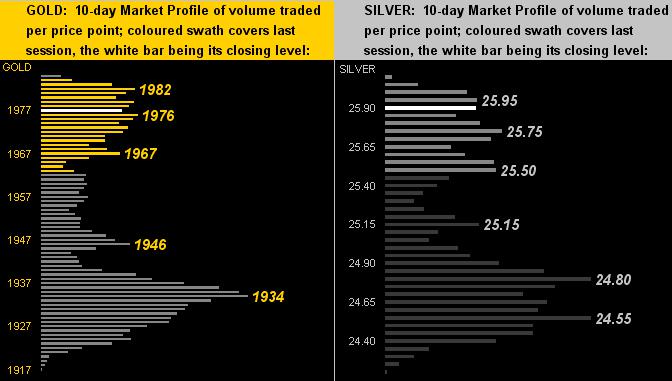
To the 10-day Market Profiles we go for Gold (below left) and Silver (below right). And for both cases respectively, should their congestion areas of 1967-1982 and 25.50-25.95 become support, then for the yellow metal 'tis "Hello 2000" and "Hello 27" for the white metal, (barring the evil parabolic Short trend having its way):
All of which leads us to:
The Gold Stack
Gold's Value per Dollar Debasement, (from our opening "Scoreboard"): 4084
Gold’s All-Time Intra-Day High: 2089 (07 August 2020)
2022's High: 2079 (08 March)
Gold’s All-Time Closing High: 2075 (06 August 2020)
The Weekly Parabolic Price to flip Long: 2071
10-Session directional range: up to 1986 (from 1916) = +70 points or +3.7%
Trading Resistance: 1982
Gold Currently: 1977, (expected daily trading range ["EDTR"]: 26 points)
Trading Support: 1976 / 1967 / 1946 / 1934
10-Session “volume-weighted” average price magnet: 1949
The Gateway to 2000: 1900+
The 300-Day Moving Average: 1816 and rising
The Final Frontier: 1800-1900
The Northern Front: 1800-1750
2022's Low: 1779 (28 January)
On Maneuvers: 1750-1579
The Floor: 1579-1466
Le Sous-sol: Sub-1466
The Support Shelf: 1454-1434
Base Camp: 1377
The 1360s Double-Top: 1369 in Apr '18 preceded by 1362 in Sep '17
Neverland: The Whiny 1290s
The Box: 1280-1240
To finish, there are (depending upon one's inclusion criteria) between 193 and 197 countries in the world, of which -- since 1980 -- 63 (32%) have at one or more times formally defaulted on their debt. As has been expected, Russia just did so for the fourth time since 1991, such default this time 'round being defined as "selective", by payment being made in Rubles rather than in Dollars, (apparently in breach of the designated requirement). 'Course, the obvious problem is the worthless Rubles cannot be converted by the bondholders into the same amount of Dollars originally lent. Arguably however, the Dollar too essentially is "worthless". So 'twould seem some levels of worthlessness are valued differently than others. Thus, here's a thought: one might get some Gold in its upstream before unaffordable becomes its gleam!
www.deMeadville.com
www.TheGoldUpdate.com
********

Mark Mead Baillie has had an extensive business career beginning in banking and financial services for two years with Banque Nationale de Paris to corporate research for three years at Barclays Bank and then for six years as an analyst and corporate lender with Société Générale.
For the last 22 years he has expanded his financial expertise by creating his own financial services company, de Meadville International, which comprehensively follows his BEGOS complex of markets (Bond/Euro/Gold/Oil/S&P) and the trading of the futures therein. He is recognized within the financial community of demonstrating creative technical skills that surpass industry standards toward making highly informed market assessments and his work is featured in Merrill Lynch Wealth Management client presentations. He has adapted such skills into becoming the popular author each week of the prolific “The Gold Update” and is known in the financial website community as “mmb” and “deMeadville”.
Mr. Baillie holds a BS in Business from the University of Southern California and an MBA in Finance from Golden Gate University.
More from Gold-Eagle


