Gold's Upward Phase Still Intact, Tops Soon


Gold saw its high for last week made in Tuesday's session, here doing so with the tag of the 1759.80 figure. From there, a sharp decline was seen into a Wednesday low of 1701.60 - before seeing a sharp rally to end the week. Note: we now move to the August, 2020 futures contract for our numbers.
Gold, Short-Term
From my comments made in prior articles, gold was seen as being in a series of short-term correction phases - though within an overall uptrend. Our last correction came as a result of the smallest cycle that we track, the 10-day wave:
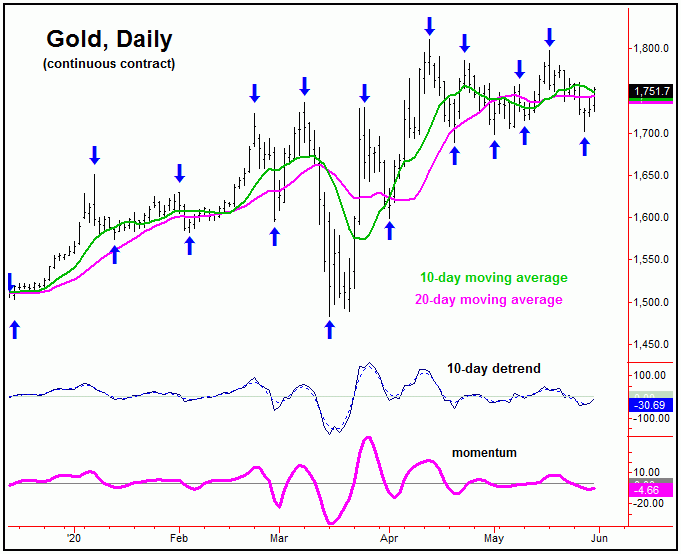
In terms of time, in our Gold Wave Trader market report, we projected a low for this 10-day wave around the May 25-26 region, plus or minus - with the actual low coming in on Wednesday, May 27th. The subsequent action confirmed Wednesday's bottom as the last low for this 10-day component - which is now seen as heading higher in the very near-term.
Having said the above, we have our larger 34 and 72-day cycles looking for a correction in the coming weeks, with the largest 72-day wave shown again on the chart below:
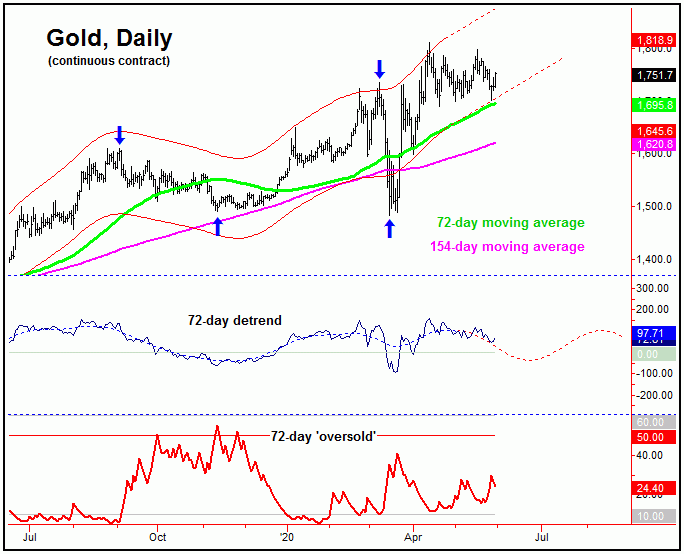
On our 72-day chart, the detrend that tracks this wave is currently pointing south - and with that the near-term upside is expected to be limited, at least until we can get the correction phase of this wave out of the way.
Going further with the above, the next bottom of significance should come from our 72-day component. We managed to exit our recent long position in the GLD (i.e., Gold-Tracking ETF) for a tidy gain from entry, and, with the configuration of the 72-day cycle, will be looking for indications to buy again in the coming weeks, depending on the action seen with technicals.
Stepping back, once the next 72-day trough is in place, then we will be looking for a spectacular rally in the months to follow, due to the larger 310-day and four-year cycles, with the larger four-year wave shown again below:
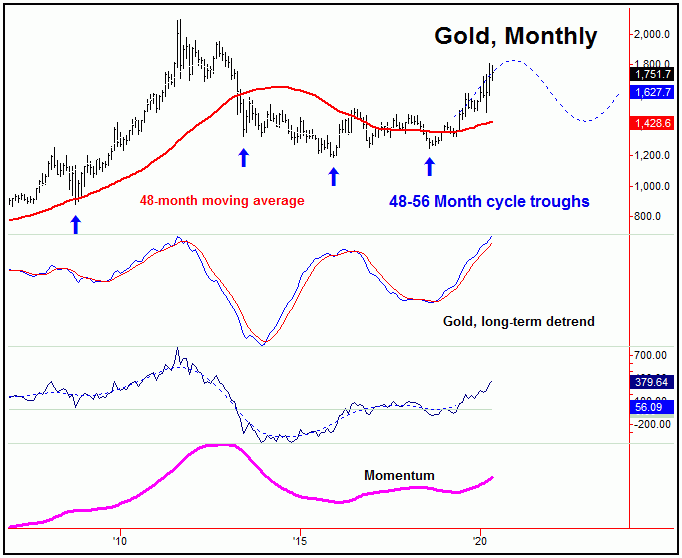
For the longer-term view, the next major top for gold should come from this four-year wave, with a speculator rally phase taking us into this peak. In terms of time, we have an exact timeframe where this wave is expected to top, once again with more precise details noted in our Gold Wave Trader market report.
Technical Indications
In looking at technical action, of note is that our Mid-Term Breadth index for gold - (an indicator constructed from the gold miners bullish percentage index) - is still pointing lower at the present time:
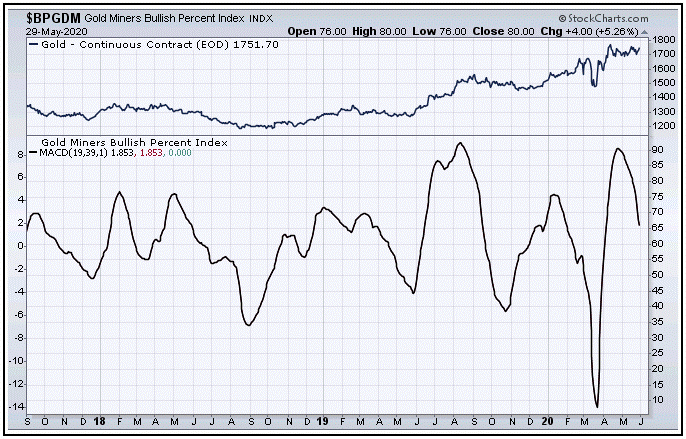
From my comments made in recent articles, with our Mid-Term Breadth index currently pointing south, the position of this indicator is a technical negative going forward, and with that should support the next correction phase of the 72-day cycle going forward, though it is too early to actually confirm this wave to have turned.
Going further with the above, what we want to see is this indicator dropping down towards the lower-end of its range (i.e., 30-40 or lower), along with some other technical signals that we track in our market report. With that, the month of June promises to offer up some very telling information for gold, along with setting up a major opportunity for the buy side.
U.S. Stock Market
From my comments made in prior articles, the last correction of importance came and went with the 45-day cycle, which was projected to trough around the mid-May timeframe, plus or minus - and which came right in line with expectation. With that, this wave is currently seen as pointing higher:
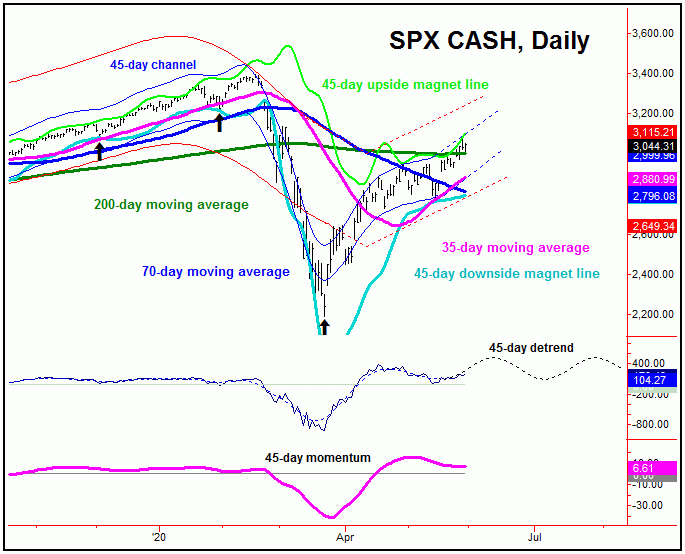
The current upward phase of this 45-day cycle is expected to give us the next peak of significance in U.S. stocks, with this cycle looking to peak the larger 90-day wave, due in the coming weeks. Here again is our 90-day component:
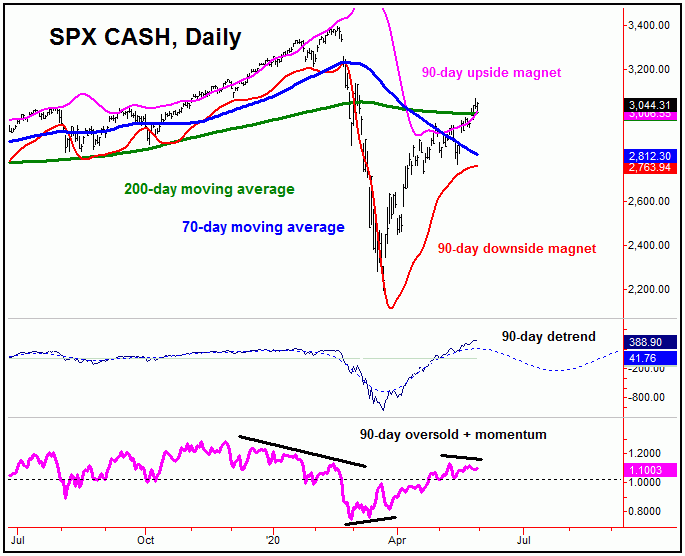
In terms of price, though it is too early to project where the next high for the 45 and 90-day cycles will be made, though the next key price level will come in around the 3100 figure for the SPX CASH index, plus or minus.
Stepping back, once the next 45 and 90-day cycle combination peak is set in place, the probabilities will favor the second largest percentage decline of the year playing out into the Summer of this year. In terms of patterns, we are expecting that decline to end up as a countertrend affair, against the late-March bottom, and - if correct - should give way to strength again (and higher highs) on the next swing up into later this year.
The Bottom Line
The bottom line with that above is that gold's near-term upward phase remains intact, but is on shaky technical ground at the present time - and is looking for a larger decline with the 72-day cycle going forward, one which should mark the last real good buying opportunity for the metal. As for U.S. stocks, the upward phase of the 45-day cycle should remain intact in the near-term, but will be looking set to peak the larger 90-day wave for a fairly sharp correction into the Summer months, though one which is anticipated to end up as countertrend - to be followed by higher highs on the next swing up with these waves into later this year. Stay tuned.
Jim Curry
The Gold Wave Trader
http://goldwavetrader.com/
http://cyclewave.homestead.com/


