The Good And Bad News For Gold Bulls
 share
share
 share
share
 share
share
 share
share
 share
share

Last week's trading saw gold holding firm into mid-week, with the metal pushing up to a high of 1807.70 - made in Wednesday's session. From there, a sharp decline was seen into Thursday's session, here dropping all the way down to a low of 1766.30 - before getting a nice rebound to end the week.
Recap and a Look Ahead
From the comments made in recent articles, the last bottom of significance for the gold market came from the 72-day cycle, which was registered in the first week of June. In terms of price, the minimum expectation called for a drop back to the 72-day moving average as this wave bottomed out, with the move down anticipated to end up as a countertrend affair. Here again is our 72-day cycle chart:
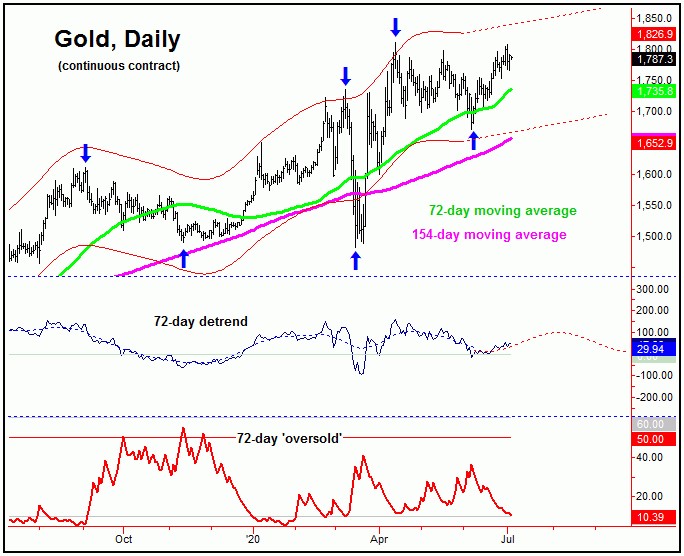
On our 72-day chart, the channels that track this wave are now turning higher, which is supportive of the current upward phase - and suggests more strength to come. In terms of patterns, we noted that any short-term correction phases - such as seen with the smaller-degree waves that we track (i.e., 10 and 20-day) should be expected to end up as countertrend. And, if correct, higher highs would follow with the upward phase of this larger 72-day component. This is the good news for the gold bulls.
The bad news for the bullish case is the fact that a cycle of a larger-degree is coming due for a top. In other words, the next peak for our 72-day cycle should also end up as top for the larger 154-day wave, which is shown on the chart below:
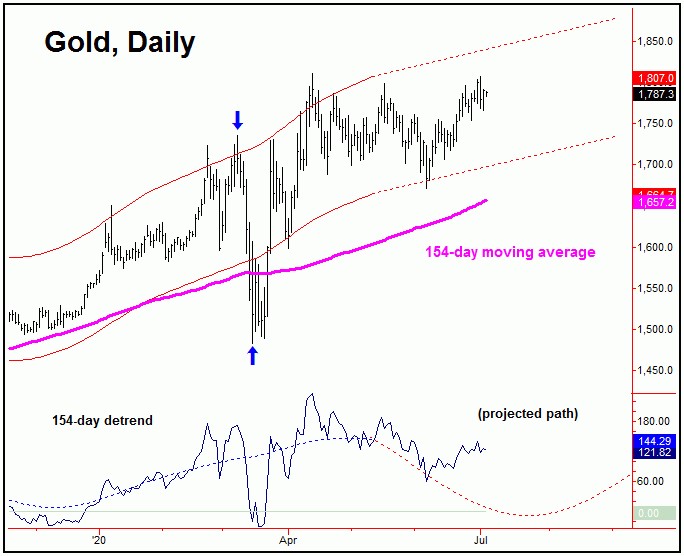
Once the combination of the 72 and 154-day cycles do top out, gold should see its second largest percentage decline of this year playing out in the days/weeks weeks to follow - with more precise details noted in our gold Wave Trader market report. In terms of price, however, in following my rule with cycles and moving averages, the 154-day moving average or lower would be an ideal downside magnet to that correction phase. In terms of patterns, that decline would still be favored to end up as another countertrend affair - due again to the larger bullish trend, which I have noted many times in prior posts.
Technical Indications
In looking at technical considerations again this weekend, our Mid-Term Breadth index is still pointing higher, and with that supports the idea of higher highs for the swing in the days/weeks ahead - before our next semi-important peak is due to materialize. Here again is our breadth index for gold:
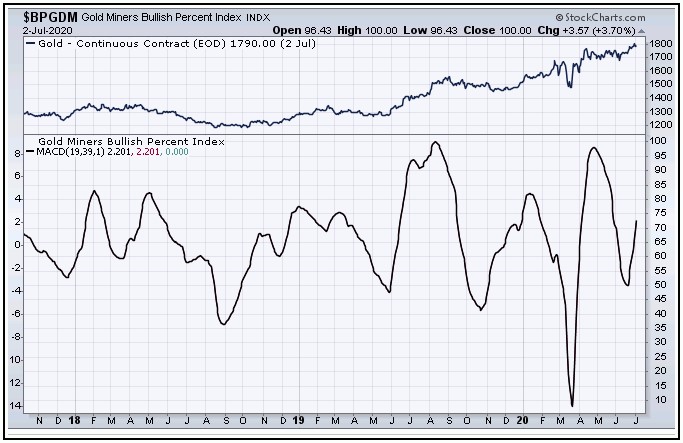
On the flip side to the above, I should point out that our Mid-Term Breadth index is now starting to diverge from the recent new high in price - which should prove to be an eventual bearish signal. That is, any turn south in our breadth index - if seen at any point going forward - would be viewed as a very bearish signal for gold, and is something we will be watching very closely going forward.
With the above said and noted, gold appears to be working on a peak of some decent significance, which our analysis tells us should come from the combination of the 72 and 154-day cycles. Even said, we still favor that peak to come from higher highs than already seen.
Back to the Good-News Bulls
The good news for the gold bulls is that a countertrend decline with the 72-day and 154-day cycles should be followed by a spectacular multi-month rally phase into later this year. In terms of price, our expectation has remained the same from past months, in that we are looking for an eventual push up to the round-2000 level or better.
For the bigger picture then, the next larger-degree peak is expected to come from the four-year cycle in gold, once again made sometime later this year. From that high, a multi-month decline is expected to play out into next year, before giving way to the next major price low for the metal - and thus the next real good buying opportunity.
U.S. Stock Market
In looking at the U.S. stock market, as mentioned in prior articles the downward phase of the 45 and 90-day cycles has been seen as in force, off the early-June peak. These waves were originally projected to top out around the mid-June timeframe. Here again is the smaller wave, the 45-day cycle:
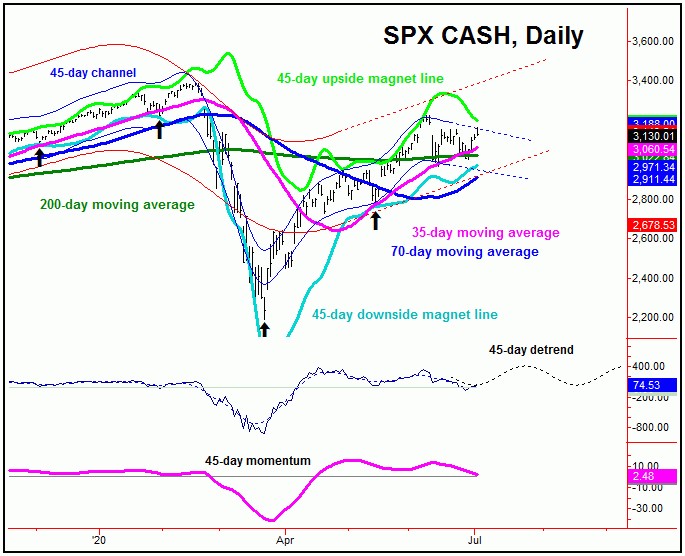
In terms of price, our ideal path had the 70-day moving average acting as the magnet to the correction phase of the 45 and 90-day cycles - something we have yet to see on the current downward phase. Having said that, as long as the SPX is able to remain below our upper 45-day cycle channel on a closing basis, there is still the potential for a spike down to this key moving average in the coming weeks.
In terms of patterns, due to the configuration of the larger 180-day cycle that we track (which bottomed back in late-March), our expectation has been that the correction phase of the smaller 45 and 90-day cycles would end up as countertrend, holding above the mid-May trough of 2766.64 SPX CASH. If correct, higher highs should play out on the next upward phase of these waves into the August - October timeframe. From there, we will need to be on the hard lookout for technical evidence of the next mid-term peak forming in U.S. stocks - which should come from the 180-day wave.
The Overall Bottom Line
The bottom line with the above is that gold's 72-day cycle upward phase is still deemed to be in force, but is expected to peak the larger 154-day cycle going forward. From that high, the second largest-percentage decline of the year is expected to unfold - though with that move favored to end up as countertrend, against the larger bull market phase. With that, from that bottom, a multi-month rally is projected to play out into later this year, before forming the next larger-degree peak. Stay tuned.
Jim Curry
The Gold Wave Trader
http://goldwavetrader.com/
http://cyclewave.homestead.com/
share
share
share
share
share


