The Good, the Bad, and the Ugly


Introduction
I've been a Clint Eastwood fan ever since I watched his first spaghetti western when I was a young boy. But the good here I'm referring to is gold, the bad is the dollar, and the ugly? The Euro. Market observers have had an easy time these past few years when it comes to the relationship between gold, dollar and the Euro. Gold and dollar are inversed to each other, while gold and Euro are in locked steps, until the past few days. When the French did not say "oui", the Euro tanked, the dollar popped, and gold? It went down in sympathy with the Euro, and then it snapped back to a $10 rally. Market observers and analysts are scratching their heads…..as usual, us technicians turn down the noise and focus only on charts and see what price action is telling us….
The ugly
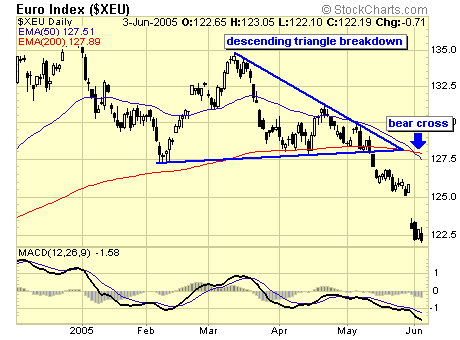
Lets look at the ugly first. As a technician, the no vote by the French was not a surprise. The euro has already broken down from the descending triangle two weeks before the vote, and now we have a bear cross, therefore, euro is officially in a bear market. Some analysts are suggesting euro is a screaming buy, yeah? Go ahead, make my day.
The bad
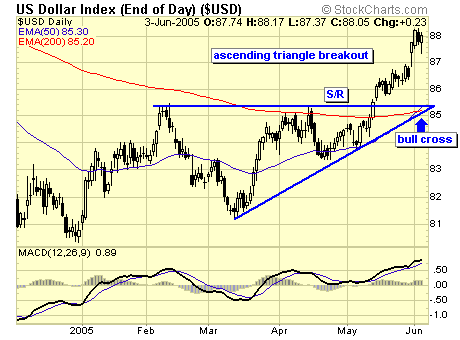
Like the young generation would say, the dollar is so bad that it is actually good. Make sense? With the two richest men in the world publicly signing a death certificate for the dollar early this year, not only did the dollar not go down, it actually went up, and up…Opposite to the euro, it broke out of the ascending triangle and we now have a bull cross. Like it or not, the dollar is in a bull market. Many analysts are still recommending shorting the dollar. Do you feel lucky, punk?
The good
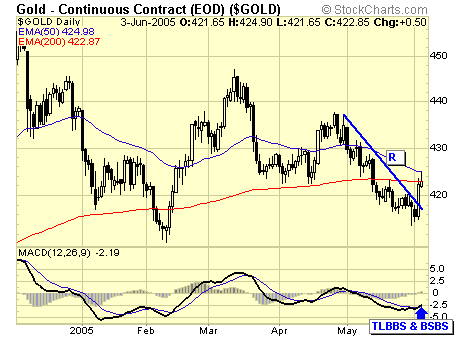
Good as gold as the saying goes. Looking at the euro and the dollar, you would think gold would absolutely tank, well, absolutely not. It rallied ten bucks after the initial drop when the no vote was confirmed. We now have a TLBBS and BSBS confirmed. So, what is going on? If we were fundamentalists, we would be searching for answers, following the herd and their stories. But we are technicians, we only need to follow price action.
MARKETS ARE DYNAMIC AND SUBJECT TO CONSTANT CHANGE
An axiom I constantly preach and practice. And that is why I do not predict or forecast. Markets need not to be predicted, only followed.
Back to the Futures
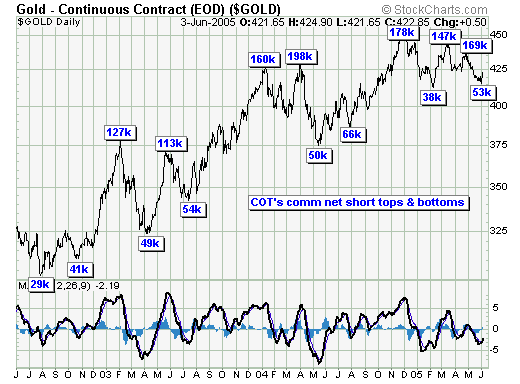
The gold futures market that is. CNS reduced to 53k as of 5/31, the day of the snap back reversal on gold. As my previous article "understanding the COT data" suggests, the major tops and bottoms in gold have been very clear when CNS are taken into consideration. If the gold bull market is to continue, now is the time. A breakdown either by price, or by CNS from here is an indication that the bull market may be over, but it isn't until it is. Do not guess.
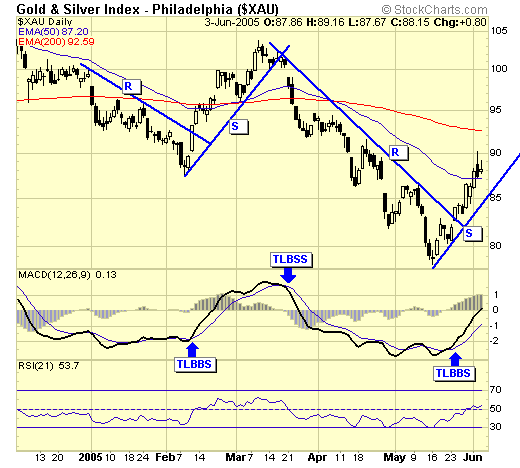
$XAU - indeed we are in a bear market on the daily chart, with a current buy signal. Is this just another tradable bounce, like all others since late 2003, or something more?
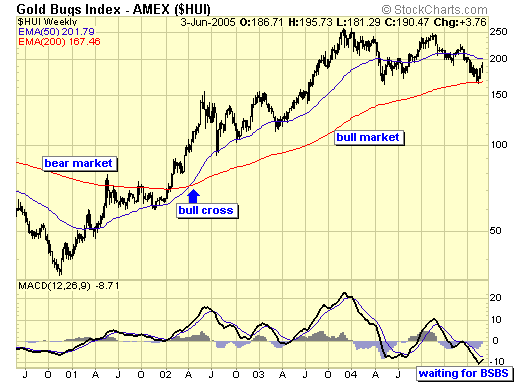
$HUI - what is different about the current TLBBS is that the weekly chart has found support at 200ema, and when confirmed with MACD, we will have a weekly BSBS, which is a major buy signal. This will be the first weekly BSBS since the bull cross, therefore, the first real buying opportunity and a low risk set up for long term investors. And this is also the last bastion for gold bulls, a failure here spells the end of the bull market. This is what separates my service and most others: there is no room for guess work, either we are in, or we are out. With the current TLBBS, we are in, and we'll let the market decide if this is just another tradable bounce, or the beginning of a major bull leg.
Preparing for the Future
We cannot predict the future, but we can prepare for it.
Like the $HUI, some gold stocks are also at the weekly 200ema…
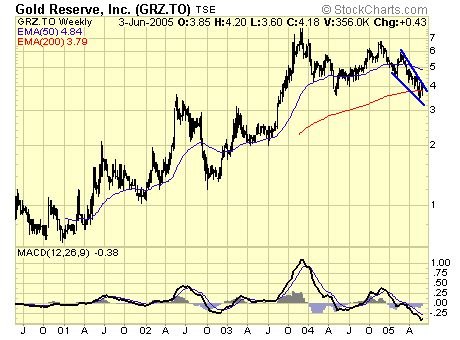

I have the full list of these gold stocks which is exclusive to subscribers, here are two examples. They all have two things in common: a possible weekly BSBS, and a minimum of 100% upside if the weekly BSBS succeeds. What is the downside risk, and how and when do we enter?
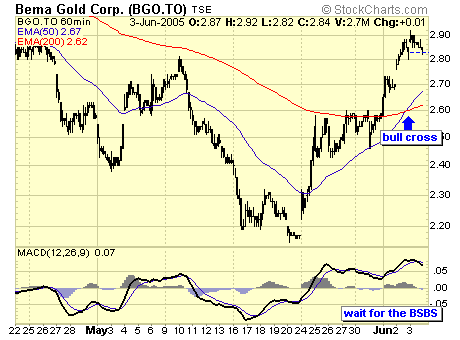
Since we are already on a buy signal from the daily chart, the next signal is likely on the hourly chart. When price pulls back to the 200ema and confirmed with MACD, we'll have a BSBS with a stop below our entry which is risking no more than 2 to 3%, with a possible reward of 100%+. Excited yet?
Summary
Opportunities like this only comes along once in a blue moon. Many of my subscribers have been patiently trading the short term with me, scalping a few % here and losing a few % there since late 2003, whether this will turn out to be the big trade like we had in 2002 and 2003, remains to be seen; but the set up is here and we must be prepared.
Jack Chan at www.traderscorporation.com
10 June 2005

Jack Chan is the editor of Simply Profits, established in 2006. Chan bought his first mining stock, Hoko Exploration, in 1979, and has been active in the markets for the past 37 years. Technical analysis has helped him filter out the noise and focus on the when, and leave the why to the fundamental analysts. His proprietary trading models have enabled him to identify the NASDAQ top in 2000, the new gold bull market in 2001, the stock market top in 2007, and the US dollar bottom in 2011.


