Good Grief! Do they really believe we are that stupid?
 share
share
 share
share
 share
share
 share
share
 share
share
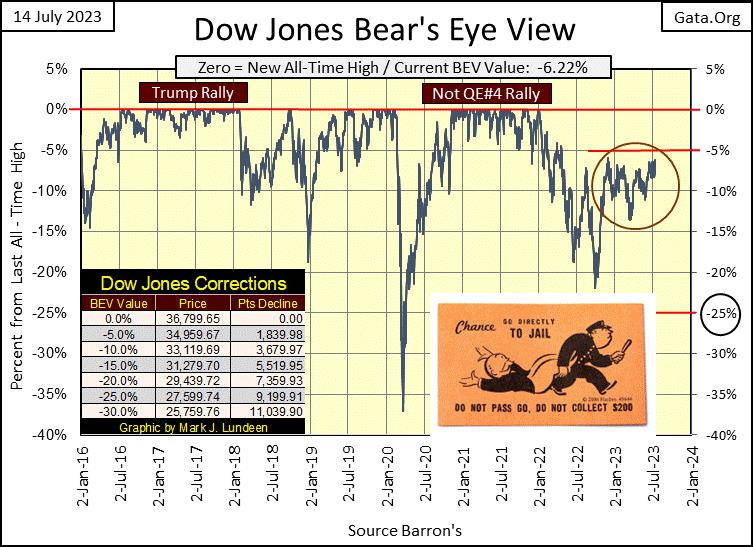
At week’s close, the Dow Jones is looking good. Looking good as it has for the past eight months (Red Circle), just short of breaking into scoring position, having a BEV value of -4.99% or less, but advancing no more. Are the bulls worried about something as they approach GO?
Anyway, eight months of coming up short every time the Dow Jones approached its BEV -5.00% line is a long time. Things are becoming predictable; so, what happens next week? Does the Dow Jones break into scoring position, and maybe even make a new BEV Zero. Or does someone once again drag the Dow Jones to Jail, preventing the bulls from passing GO, and collecting their $200?
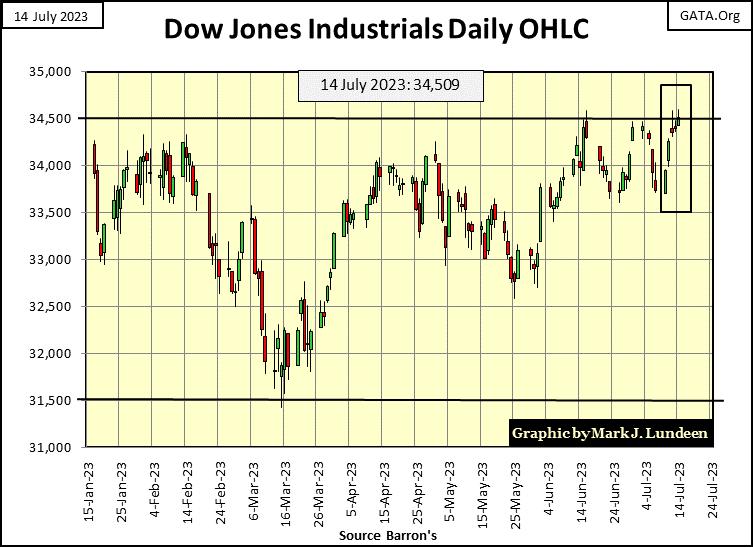
The Dow Jones closed above 34,500 at week’s close in its daily bar chart below. But if you asked me, closing above this important line of resistance by only $9 shows a distinct lack of commitment by the bulls. Unless the bulls can do better than this next week, it’s hard believing much will come from their current advance towards market history.
Okay, I could be wrong. I’ve been wrong before. Maybe next week the bulls will drive the Dow Jones far above 35,000 in the chart below. If so, I’m man enough to admit I didn’t know what I was talking about.
But after eight months of having the bulls coming up to 34,500, and then always calling it quits when it does, it’s the bulls, not me with something to prove to the market; that they have what it takes to take the Dow Jones into higher territory, and then keep it there. As it is right now, I doubt the Dow Jones will do anything but close next week somewhere below 34,500.
After reading the above, some of my readers don’t know whether they should be bullish, and buy the market on margin, or take this month’s mortgage payment and purchase some puts on the Dow Jones. My advice is they should do neither, but do what I’m doing.
Find a comfortable seat up here in the bleachers, high in the market’s peanut gallery, far above the playing field below, and bet no more than * One Beer * the Dow Jones will do one or the other, and then sit back and enjoy the show. This is one dangerous market to be risking one’s money in, for both bulls and the bears.
Looking at the major market indexes I follow below, by using my Bear’s Eye View format (BEV), where the negative percentages seen are percentage claw-backs from these indexes last all-time highs, we see that none of them closed the week in scoring position; within 5% of their last all-time high.
Nothing new about that. This has been the same old tired tune the bulls have been whistling for months now; So Close, Yet So Far. Everyone is so sick of listening to that. But such is the life of a market watcher, as is enduring the time coming when we’ll all see more excitement in the market than we’d care to see.
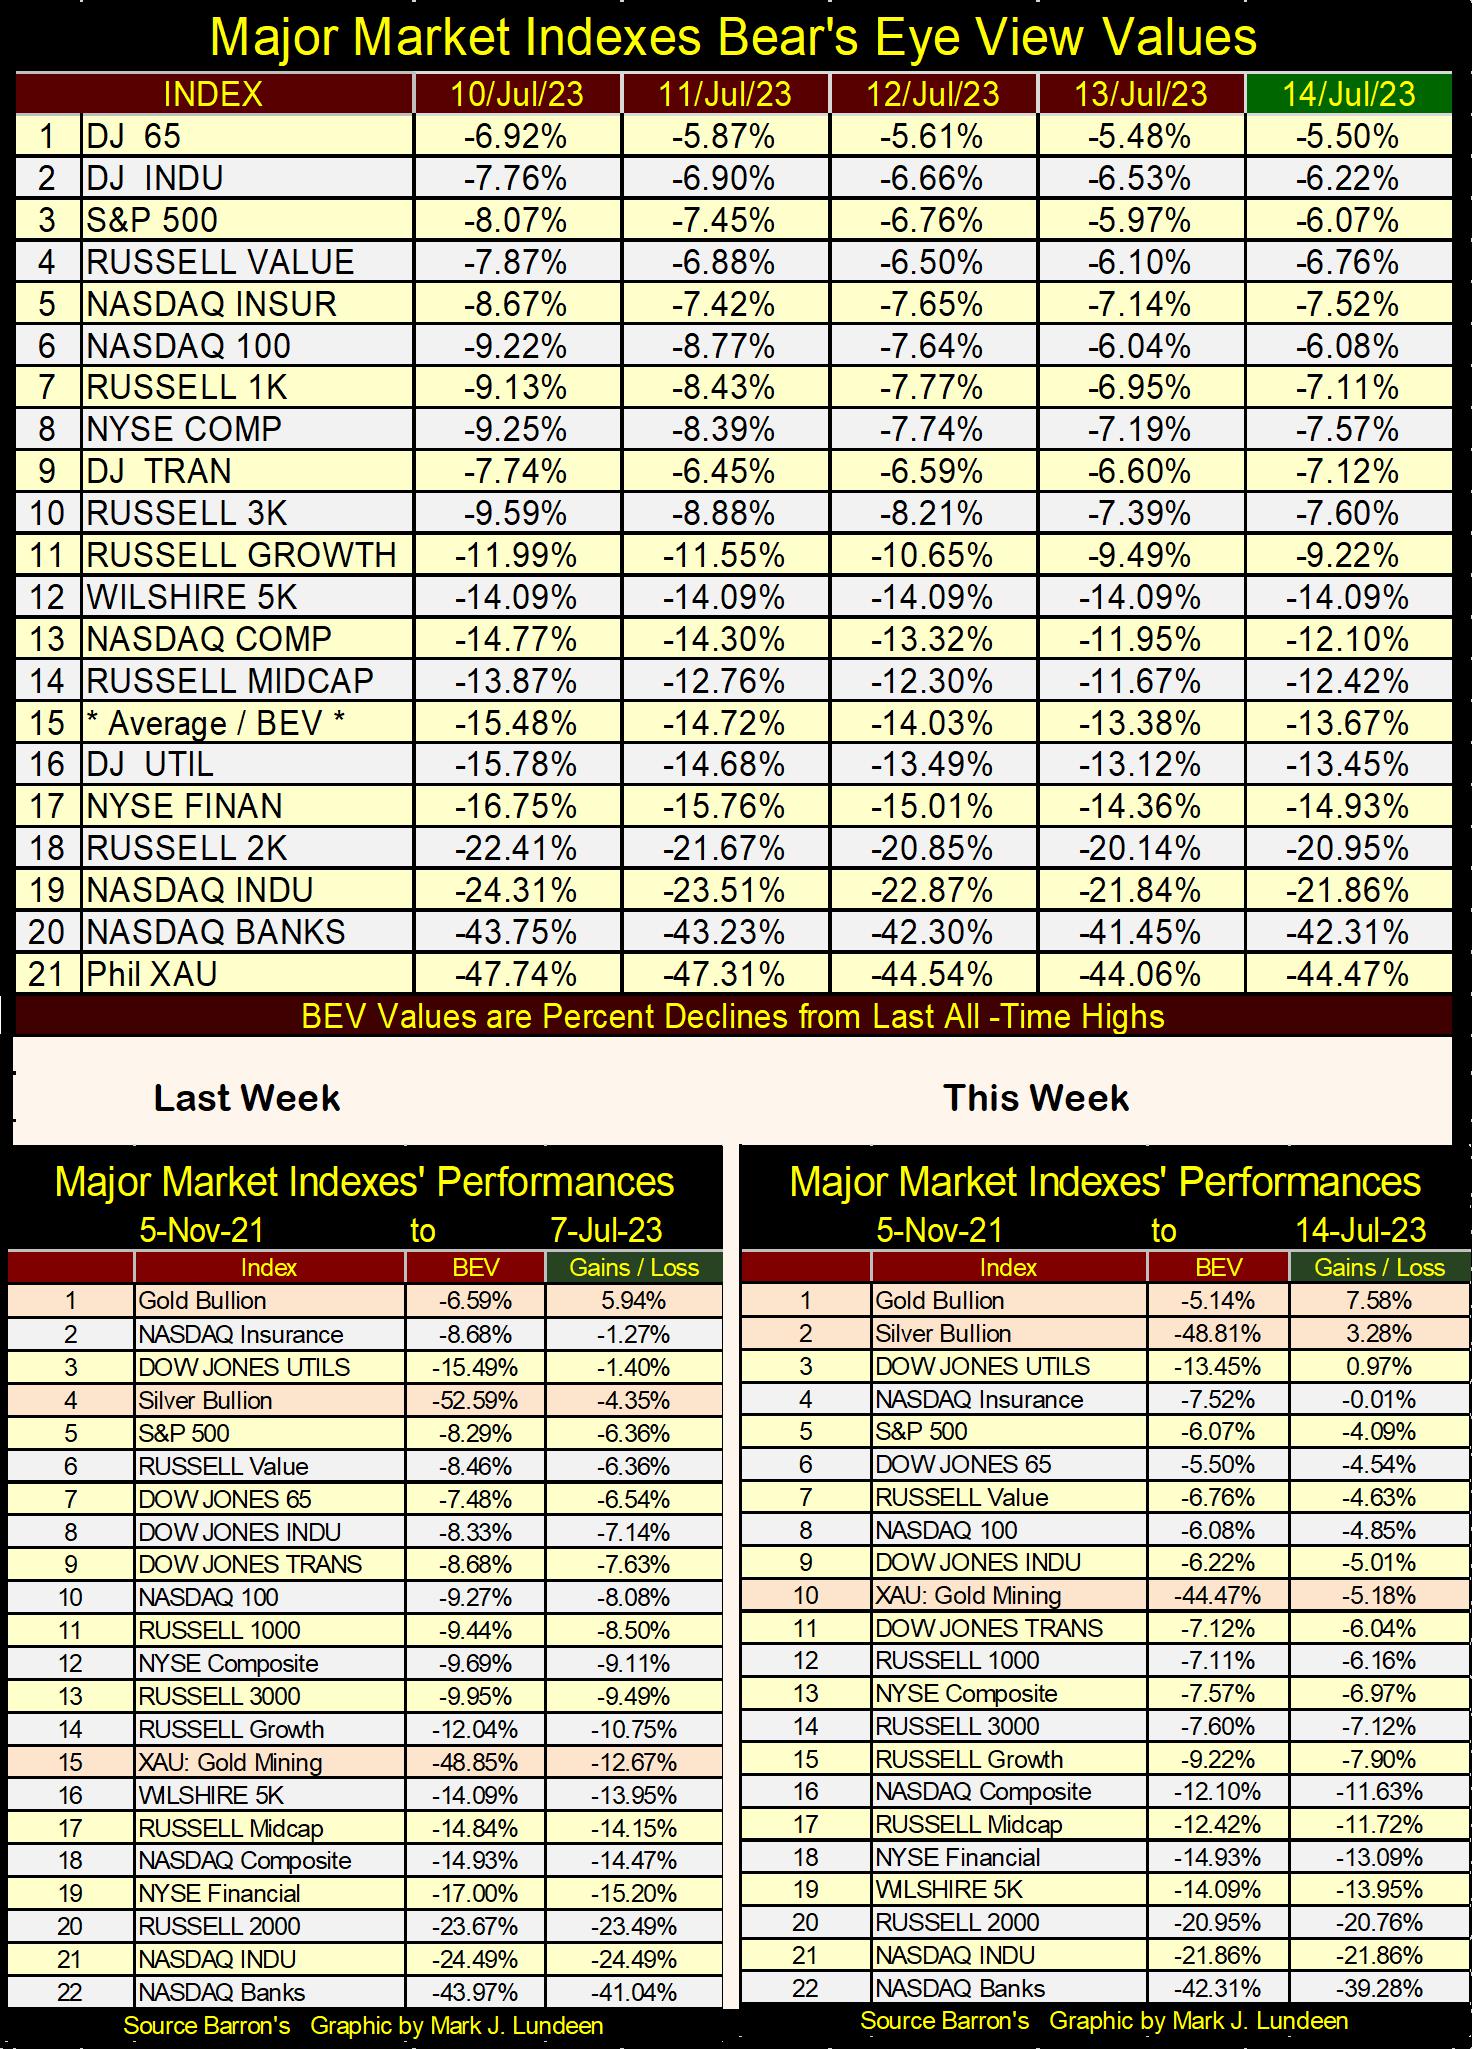
In the performance tables above, the precious metal assets were the best performing assets this week. Compared to last week; gold (#1) was the slowest sprinter of the three, advancing less than 2% from last week. Silver (#2) advanced just short of 10%, with the precious metal miners in the XAU (#10), up about 7.5% from last week.
To be fair, everything in this week’s performance table also advanced from last week, but short of the gains seen in the old monetary metals and their miners. Are we witnessing the market developing a new trend, a preference for money to flow into precious metals assets? With all nincompoopery now dominating global economic and political “policies,” that must happen sometime, so why not now?
I haven’t covered commodity prices for quite a while, so this week seems a good time to revisit this important topic. The plot below is derived from the indexed values of nineteen commodities, with 23 August 1993 = 1.00. I then average these weekly commodities’ gains / losses from their August 1993 base, to derive each week’s value.
Note for the table in the chart, I have included various stock market indexes. These indexes Are NOT Used in the calculation for the plot below, but included in the mix to provide a comparison for the commodities with the financial market. As of this week, the stock market (#1-3) has outperformed commodities since 1993 by a good margin, except for the XAU, tail-end Charlie at #24.
Should consumer price inflation resume, and it will, the rankings within this table will change dramatically. We’ll see the XAU and commodity prices rise, as the valuations in the stock market indexes deflate. But when? I don’t have a clue when, just that in due time, this is going to happen.
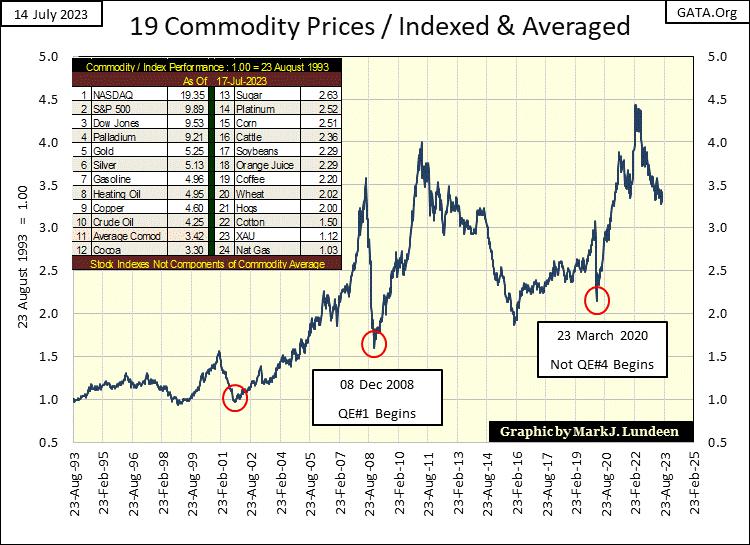
The latest surge in commodity prices began in March 2020, and then peaked in February 2022. Commodity prices have since retraced some of their gains from March 2020, but given time, and an ever-weakening US dollar, these commodity prices must rise once again.
What I believe is the key observation to make in this chart, is how fatuous any claim the Federal Reserve has to being an “inflation fighter. Note the three red circles in the chart above; each occurred near the bottom of a market crisis for the FOMC;
2000-2002 NASDAQ High Tech Bubble bust,
2007-2009 Subprime Mortgage Bubble bust,
March 2020 Flash Crash.
The first in 2001, happened during the NASDAQ High-Tech bust. To counter the bust in high-tech, then FOMC idiot-primate, Alan Greenspan, began inflating a bubble in single family home values with sub-prime mortgage. The chart above makes it very clear it wasn’t just home valuations that began inflating in 2002.
This is a significant observation; when the FOMC inflated the NASDAQ High-Tech bubble from 1993 to 2000, commodity prices were not affected in the chart above. All that changed after 2002, around the same time gold bottomed at $253, and began an advance that continues to this day, as is true for commodity prices in general.
Come the bust in single-home valuations, when the sub-prime mortgage market went bust in 2008, commodity prices also began collapsing in July 2008. Like the market bust in everything else during the 2007-09 market crisis. But bust soon became boom, following FOMC idiot-primate, Doctor Bernanke’s, massive “injection of liquidity” via his QE#1 in early 2009.
The third red circle in the chart above occurred at the turn of the market collapse in March 2020, when our current FOMC idiot-primate, Jerome Powell, inflicted his monumental Not QE#4, on the financial markets. A massive “injection” of multiple trillions of dollars in March, April 2020, not only had the expected results in the stock and bond markets, but also on commodity prices.
Here is another observation not noted in the mainstream financial media, but one on display in the table above; since 2000, peaks and valleys seen in valuations in the stock market, have been mirrored in the commodity market. That isn’t supposed to happen.
What the “policy makers” want to happen, is for their “injected liquidity” to flow into the valuations of financial assets, and bypass the commodity markets, as seen from 1993 to 2000 in the chart above. But since 2002, that isn’t happening anymore, their “liquidity” is now also flowing into commodity prices.
What keeps a “policy maker” up at night, is the fear their “injections of liquidity” will one day flow into commodity prices, bypassing the financial market’s valuation altogether. In due time, this is going to happen, and it will be the end of the Federal Reserve System as we know it.
The weather here and now is pleasant enough. No reason not to go outside and enjoy the sunshine. But looking off to the horizon, and you will see the violent storm front approaching us. When it’s overhead, everything will change beyond recognition. What am I talking about? It’s not just me pointing this out, anyone who can read a chart can see it; bond yields and interest rates are rising.
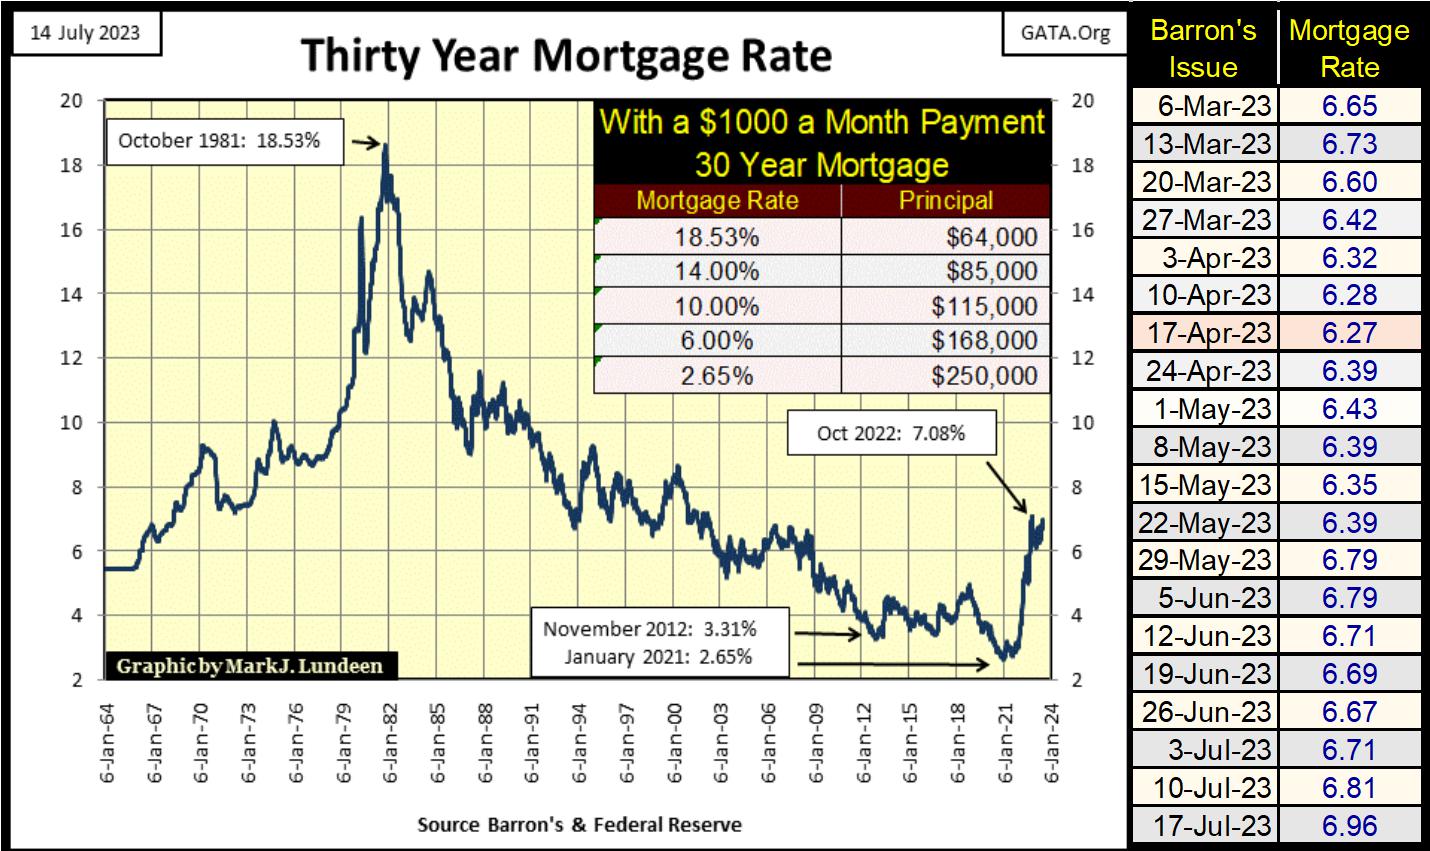
The problem may best be seen with the mortgage market, chart below. From October 1981 when mortgage rates peaked at 18.53%, to January 2021 when rates bottomed at 2.65%, the United States enjoyed a forty-year bull market in single family homes. Forty-years of politicians bragging about the middle-class prosperity they legislated into reality, of bankers pocketing huge fees in the mortgage market, and home owners doubling their “home equity” every few years.
But it was all inflation, as seen in the table in the chart below, where a $1000 a month payment could service an ever-larger mortgage, as mortgage rates were manhandled downward for forty-years. It was a financial, multi-decade long miracle made manifest by a bunch of idiots dictating “monetary policy” and mortgage rates at the FOMC.
But mortgage rates bottomed a few years ago, and now are advancing. So, this mighty bull-market engine in residential-real estate, has shifted into reverse, and valuations in the real-estate market are destined to deflate in a huge bear market.
The article above suggests a generational bear market in debt. That is how I see it too. As the residential real-estate market is so over leveraged, when the storm arrives, don’t doubt for a moment that one of Mr Bear’s first acts of devastation, will be shock waves of defaults in residential real estate. This has already happened in commercial real-estate, with strip malls and retail spaces lying abandon, in once prime retail and office-space locations.
Market valuation based on 2.65% mortgage rates seen in January 2021, cannot, so will not be supported when mortgage rates rise above 7%. Trillions of dollars in mortgage assets held by financial fiduciaries, and the Federal Reserve itself, will ultimately be forced to be written down, or completely off their balance sheets. Exactly what that means to you and me, we’ll all find out together.
People usually think of bonds in terms of yields. But like mortgages, bonds also have valuations. In the chart below I’ve plotted the price of Dow Jones Corporate Bond Index, and it’s not a pretty picture.
Bond prices move inversely to bond yields, where falling bond yields results in rising bond prices. The blow-off stage of a massive forty-year bull market in bonds can be seen from November 2018 to the end of 2021. But then there was the unpleasantry the financial system had in March 2020, where prices for this bond series deflate by 15% in only ten trading sessions! In American finance, I don’t believe that has ever happened before with an index of investment grade bonds.
The FOMC’s idiot-primate; Jerome Powell, in March 2020 announced the FOMC began monetizing corporate bonds. Exactly why is seen below; to prevent an implosion in the multi-trillion-dollar corporate bond market.
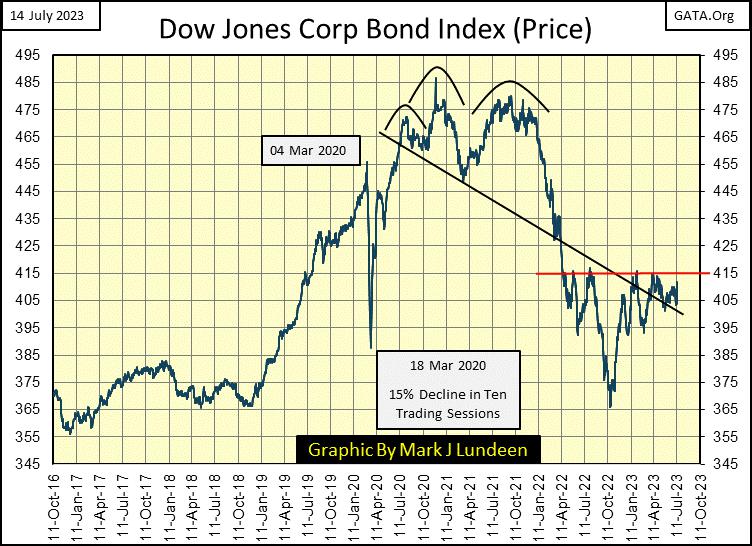
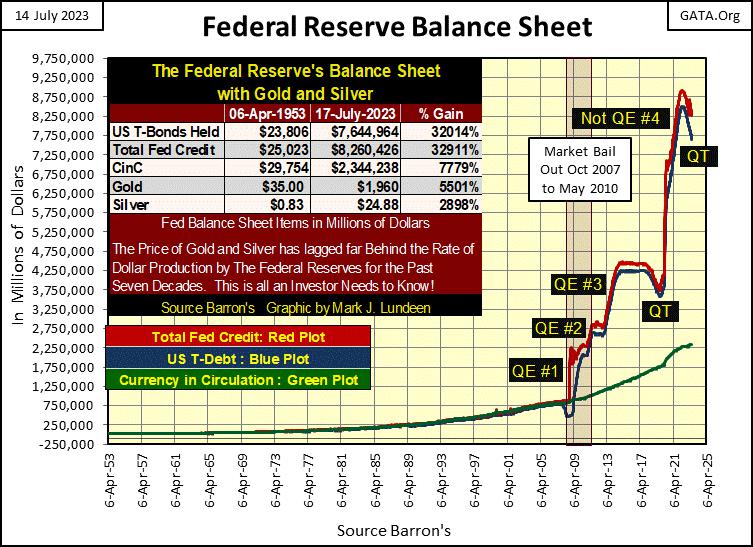
In the history of the Federal Reserve, I know that had never happened before; the FOMC began monetizing corporate bonds. I know that as Chairman Powell said so in the FOMC’s press release issued in March 2020. The result of this “monetary initiative” (call it NOT QE#4) can be seen below in my chart of the Federal Reserve’s balance sheet. With it, the bull market in corporate bonds resumed, as the FOMC “monetized” corporate bonds by the tens-of-billions. That was until January 2021, when a massive bear market in debt began, following a classic head and shoulders top chart formation, seen above.
Currently, 415 has been a strong line of resistance since April 2022. This week the Dow Jones Corporate Bond Index closed at 410.43. How long before this bond index’s valuation deflates below 365, where it closed in October 2022? I don’t know. I just know it will, before it goes far below that as bond yields rise into double-digits.
Double-digit corporate bond yields? Is that even possible? It has before, as seen below. And it will again for the same reason bond yields increased above 10% in the late 1970s; lack of confidence in the global financial system, of the competence of the idiots managing “monetary policy” at the FOMC.
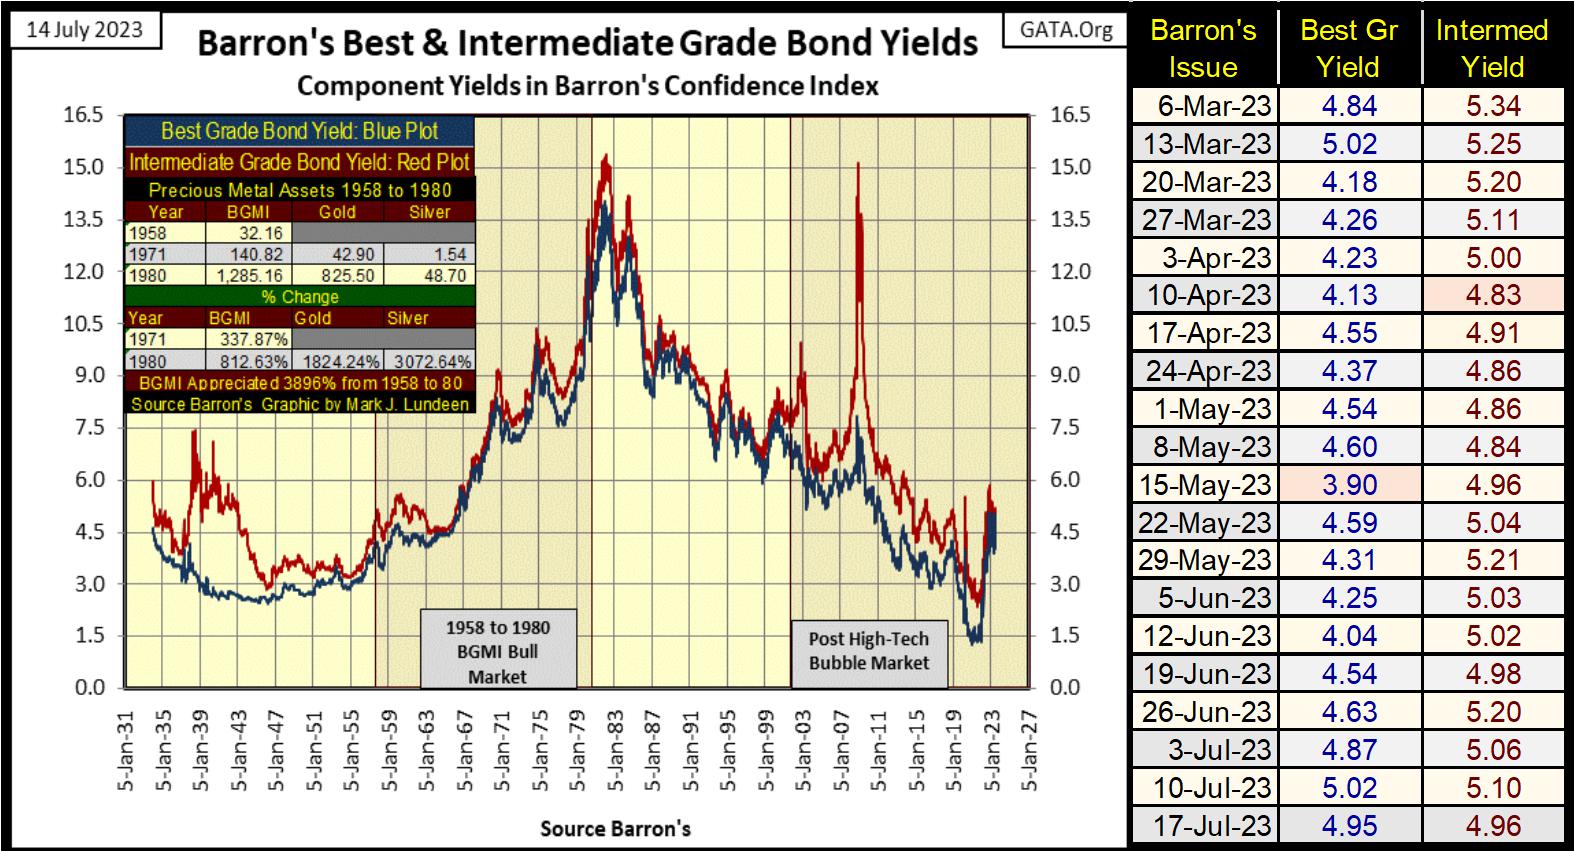
Look at these two corporate bond series’ yield spikes since 2021. Barron’s Best Grade Bonds’ yields bottomed at 1.29% in January 2021, and spiked to 5.03% in November 2022 – Wow! Barron’s Intermediate Grade Bonds’ yield spiked from 2.38% in July 2021, to 5.85% in November 2022. It’s understandable why the mainstream financial media spend so little time exploring the debt markets, as doing so may freak-out their viewers, as what is seen above isn’t normal, or good.
Things could change. Bond Yields and interest rates could once again begin to come down. But I don’t see how, not as President Biden, and Washington’s political establishment is committed to drive the United States ever deeper into debt. A few weeks after Congress removed the debt limit, the national debt is now over 32 trillion, only 500 billion from 33 trillion dollars.
The Federal Reserve continues with a QT it began in May 2022, but should the market begin melting down, we can be sure they’ll begin their QE#5. The impact that will have on the Federal Reserve’s balance sheet below is very predictable, as was their QE #1-3 and Powell’s own Not QE#4.
What these idiots have done to their balance sheet (our balance sheet / chart below), the only thing supporting the US dollar, after they took the dollar off the gold standard in 1971, is a disgrace. What’s seen below may not be a hanging offence, but more than a few people deserve something seriously unpleasant for bringing down the United States of America. A few months in the county work-house at a minimum, because they must have known better; still, they did it.
The future of the US dollar is growing dim, and in the growing darkness, so too is any reason for holding dollar denominated debt; Treasury, corporate bonds, and mortgages. Double-digit bond yields? In July 2023; they are already baked into the cake, and it’s only a matter of time, maybe only a few years before they become an everyday reality.
What is seen above is a crime scene, and all too many of America’s elected office holders in Washington, are accessories before, during, and after the fact. And after all this, these people now want to dump the dollar they destroyed, and move on to a digital currency issued by the Federal Reserve.
Bloody-Hell No! Do they really believe we are that stupid? Sad to say; all too many people are.
Eric King’s, King World News has an excellent article by Alasdair Macleod, head of research at Goldmoney, on the BRICS are coming out with a gold backed currency.
Alasdair is a sharp guy, and has many insightful items in this article I don’t doubt will come about in due time. Short term, the BRICS and their gold backed currency could liberate the price of gold in dollar terms, so this is good news.
But long term, this gold backed currency by the BRICS;
Brazil,
Russia,
India,
China,
South Africa,
will prove to be just another gold backed currency, one more disappointment to those who wish to have a stable unit of money.
Are we talking about monetizing gold and silver coins here, and have them convertible with paper money at a bank, as was a US$20 double-eagle gold coin, with a US$20 paper dollar bill a century ago?
Or are we talking about the Euro in the late 1990s, where its proponents emphasized their new European currency’s reserves were to be 15% gold. European bankers don’t talk about their currency – the Euro’s gold reserves any more, and I know why. It was a gold backed currency, with the paper currency being monetized. Its 15% gold reserves never saw the light of day, just a golden sales pitch to draw the suckers in.
Looking at the list of countries in the BRICS; India and China are almost at war with each other, and that isn’t going to change. South Africa can’t keep its lights on. I wish them luck with their new gold backed currency, but I’m not optimistic.
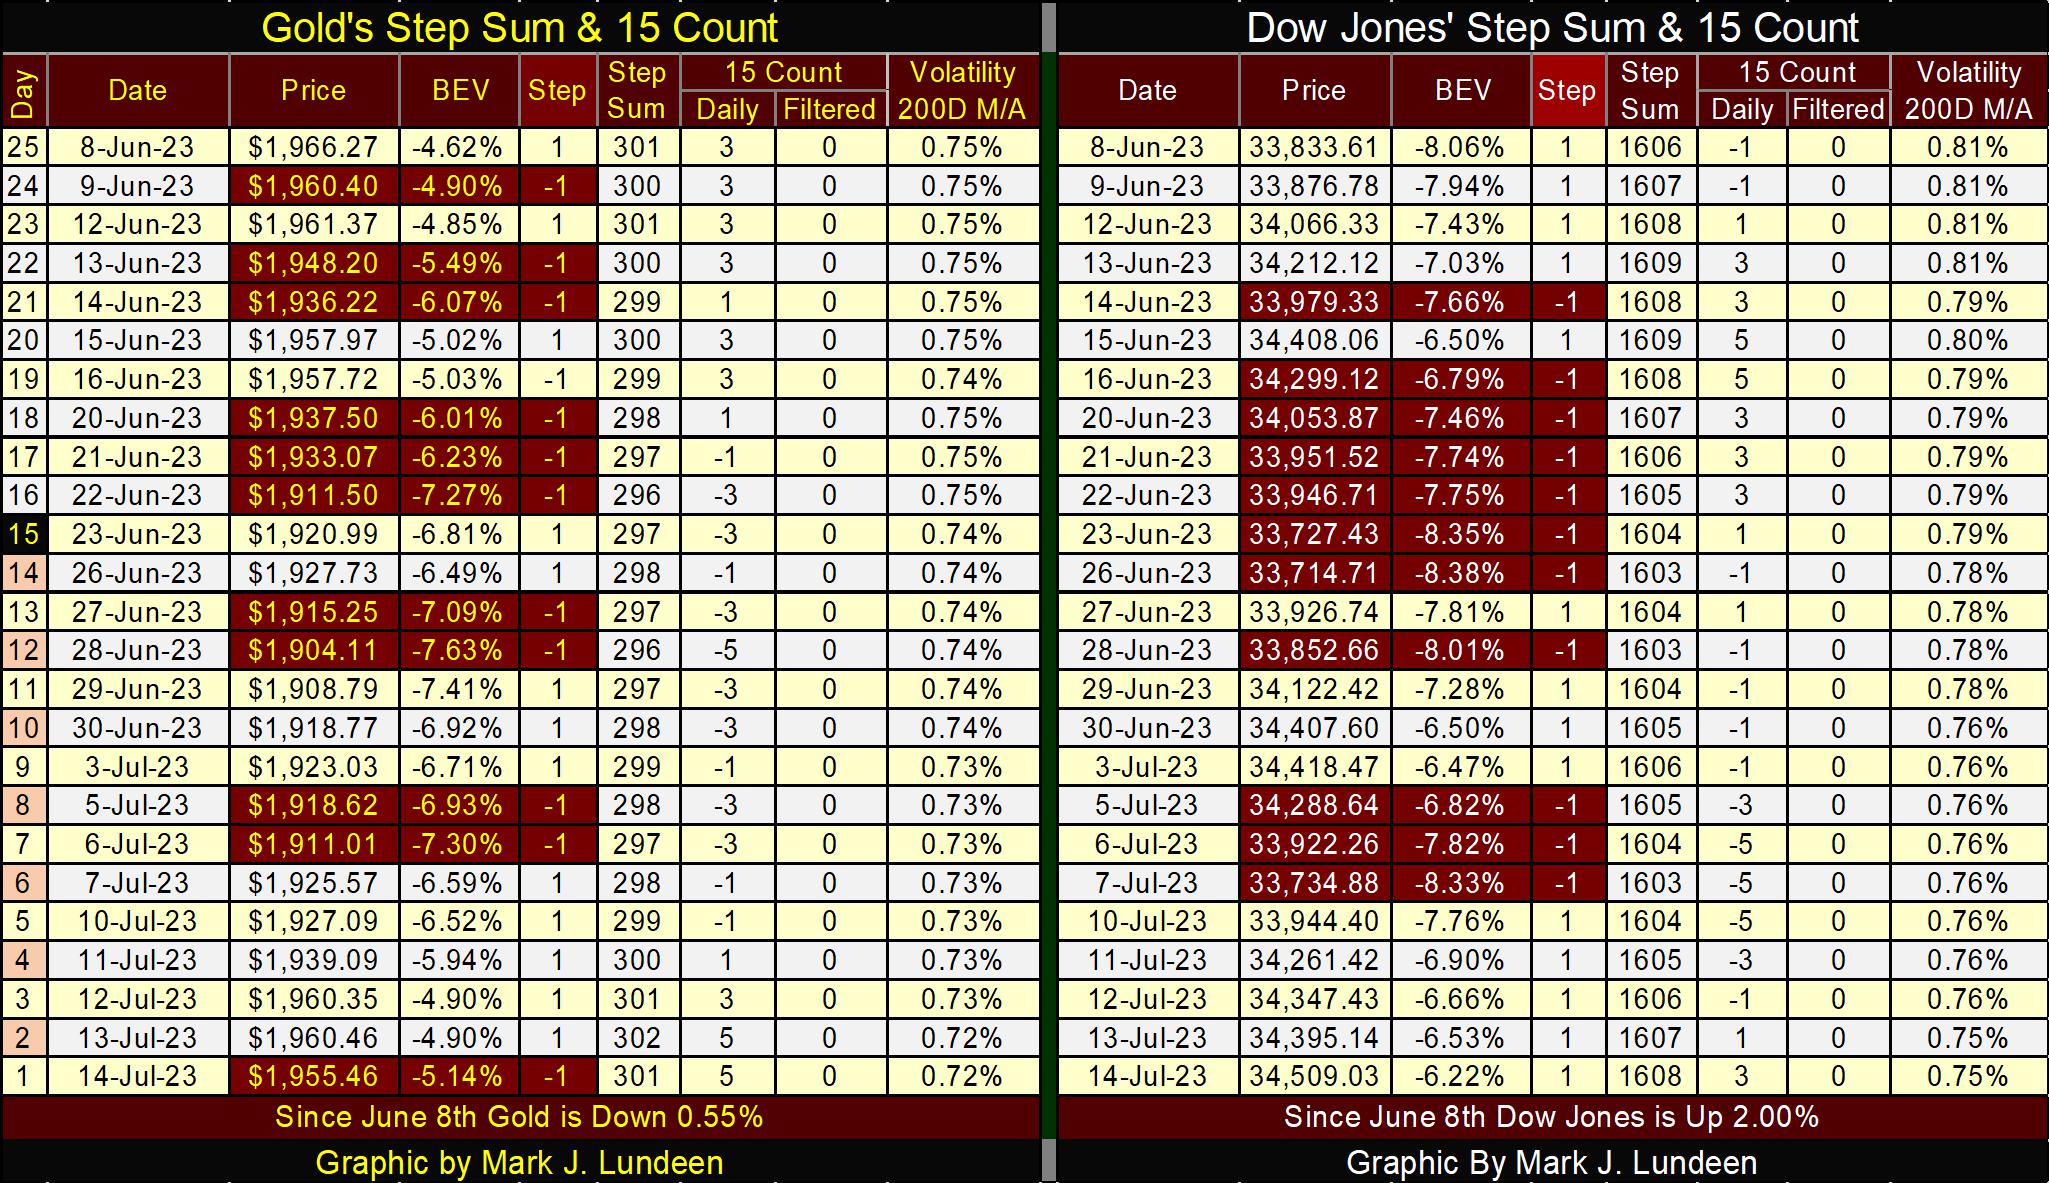
Moving on to gold’s BEV chart below, it closed the week with a BEV value of -5.14%, fifteen basis points from closing in scoring position (-4.99% to -0.01%). I like what I’m seeing below. In the past month, the bears made several attempts to force gold below its BEV -7.5% line, succeeding for only one day (June 28th: BEV -7.63%). Failing that, gold actually closed in scoring position on Wednesday and Thursday of this week, both days gold closed with a BEV of -4.90%.
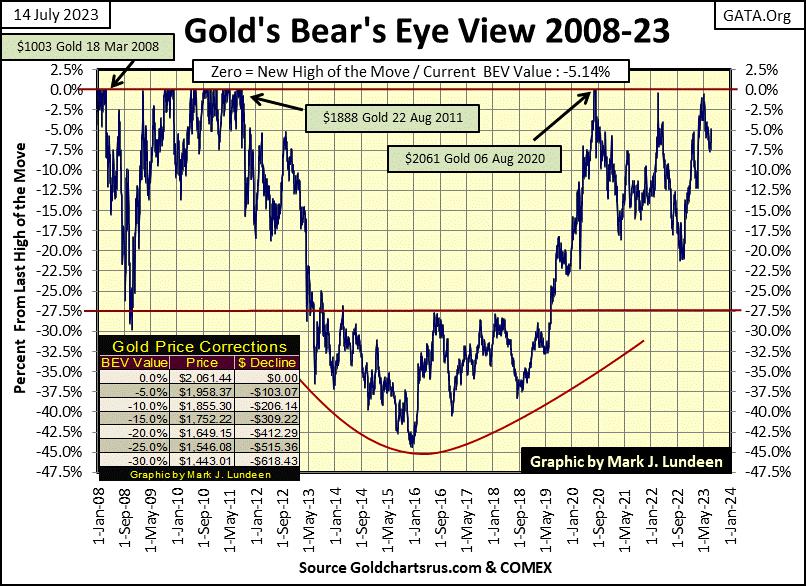
The daily details of this market action can be seen in Gold’s Step Sum Table below, in gold’s BEV values from June 16th to the close of this week. If the bulls can keep gold in scoring position in the coming weeks, we may see gold’s first new all-time high since August 2020, three years ago. It about time we see something like that happen in the market.
One problem that could improve in gold’s table below, its daily volatility’s 200D M/A continues creeping lower, closing the week at 0.72%. It is, what it is. But should gold see a new all-time high, a BEV Zero (0.00%) any time soon, don’t get me wrong, it will be nice; nice like kissing your Aunt Betty.
HOWEVER, and maybe the young ladies reading this should skip past these next few sentences, BUT should gold’s daily volatility’s 200D M/A rise to, and then spike above 1.00%, owning gold will then be like having a hot date with Sophia Loren. Okay, Sophia is 88 years old this year, but I’m not a spring chicken either! Maybe I should say a hot date with Sophia back in 1970. In any case, owning gold when its daily volatility spikes, will become something wonderful.
Writing this week’s article left me in a foul mood, wondering how best to end this week’s catalogue of malfeasance seen above?
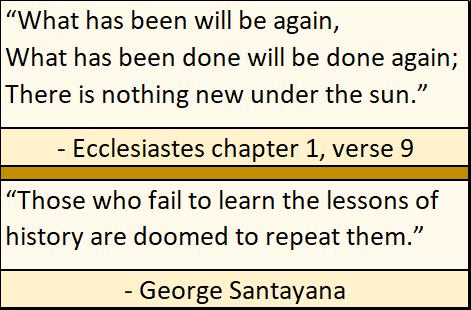
Over the years I’ve accumulated a few quotes from articles and books I’ve read. Here is one of my favorites; it’s from the Bible’s book Ecclesiastes, which I’ve coupled with a famous quote from George Santayana, who said essentially the same thing:
So, what lesson of history are we today in the 21st century forgetting? That human beings are fallen creatures, as all have fallen short of the glory of God. That is especially so for any cultures’ elite, whether they be the nobility of Europe’s mediaeval past, or today’s members of the World Economic Forum (WEF). Both got to the top because they willingly crawled over the bodies of others to get there. Once there, both desired to bind all the little people beneath them to their land, to best protect their “inferiors” from everything – but themselves.
In the mediaeval past, Europe’s nobles called it serfdom. Today, our “policy makers” have yet to coin a phrase for it, but the “15-Minute Cities” they envision for humanity, will prove to be no less a state of serfdom.
https://en.wikipedia.org/wiki/15-minute_city
Here are a few quotes from my stack from Europe’s mediaeval past, though you can be sure it was no better anywhere else, say in ancient Asia, Africa or Meso-America.

Below is a poem that was left without a title, but one I call; Easter in England. It was written in the 12th century by a Norman Lord, during the reign of England’s King Henry II. Update the poem’s nomenclature on its ordnance from shields and swords, to F-16s and cluster bombs, and Washington’s many chickenhawks could use it to wax poetic for their wars in Afghanistan, Iraq, and now in Ukraine.

Yep, the more things change, the more they stay the same. See you guys next week.
Mark J. Lundeen
********
share
share
share
share
share


