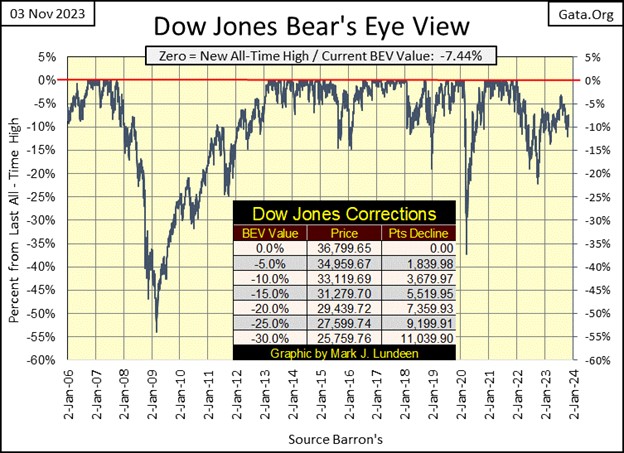
A Great Week for the Dow Jones But What about Next Week?


The stock market was remarkably strong this week; five daily advances that lifted the Dow Jones up by 4.47BEV points in the chart below, or 1,644 points since last Friday. I’m not going to argue with success, it was a very good week for the bulls. But what about next week?
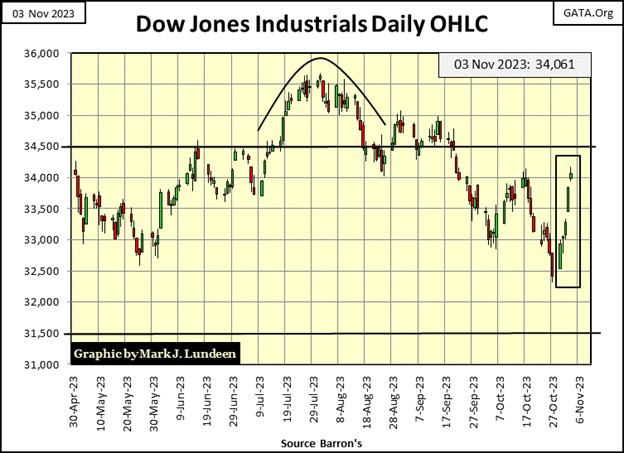
Looking at the Dow Jones in daily bars below, I ask again; what about next week?
This week’s close at 34,061, wiped out all the losses of the past two weeks. We have to go back to late September to see the Dow Jones closing above 34,000, and all that this week, in only five trading days. That is the good news for the bulls. The bad news is with an advance such as we see below, Mr Bear will be eager to see how serious the bulls are, to advance the Dow Jones to higher levels. Can the bulls take it, as well as they dished it out?
Meaning I’m expecting a pullback, somewhere below 34,000 sometime next week, or the week after. Does this correction I’m anticipating to bottom around 33,500, before taking the Dow Jones to new high of the move well above 34,000? That is what would happen in a bull market, for the bulls to begin buying on market weakness, as they did from the lows of last Friday.
Or do the gains we’ve seen this week only invite more selling, by those who want to lower the risk profile in their portfolio by selling into this week’s strength. That is what I’d expect to see if this is a bear market, for the Dow Jones to begin going down from the highs of this week, taking out all the gains of this week, and then some.
Moving on to my major market indexes BEV values below, every index below advanced this week, some by a lot. This data set’s average (#14), advanced by 3.48 BEV points from Monday to Friday’s close; that is big move for an average. The NASDAQ Banking index (#20) was up by 4.68 BEV points, the largest weekly advance of the indexes seen below. I wouldn’t put a dollar into the banks, but this week the bulls were big buyers of the banks.
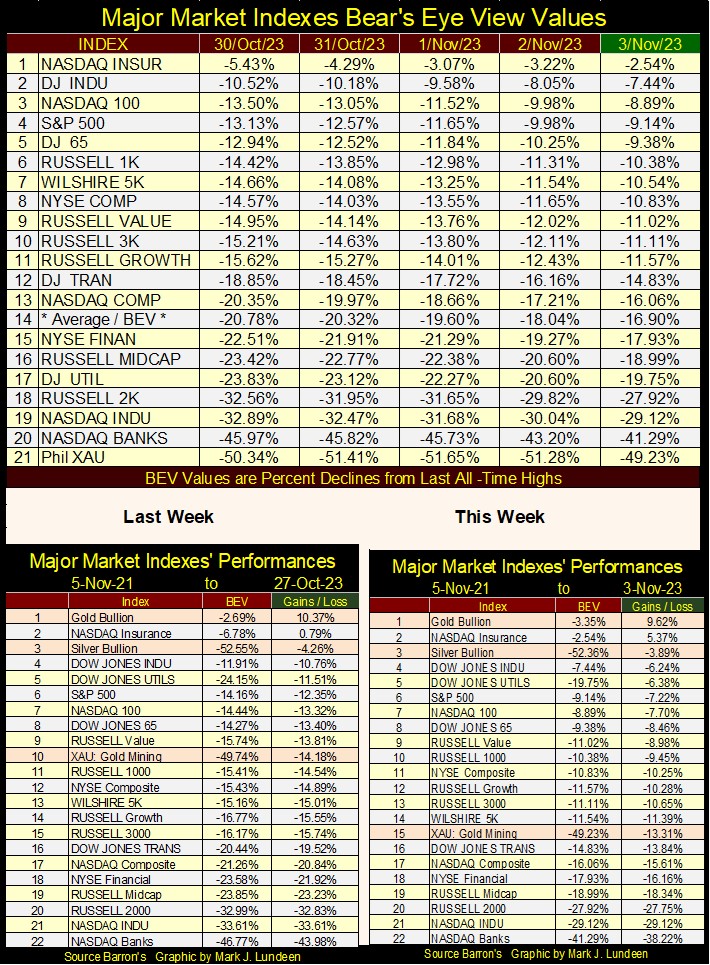
In the performance tables above, gold remains at the #1 spot, and silver at #3. The XAU fell back to #15, from last week’s #10. But the XAU was up for the week, just not as much as the other indexes that moved above it this week.
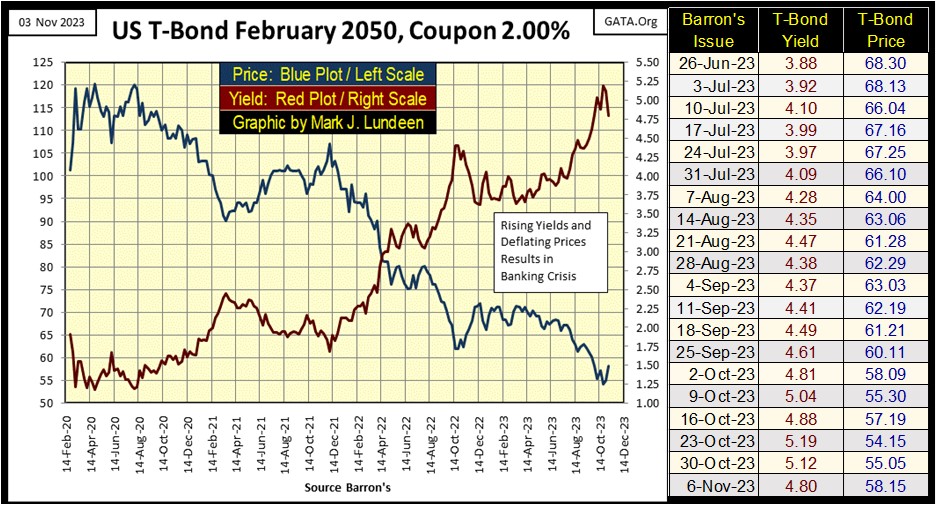
So, what got the stock market to move up as it did this week? Looking at the bond yields and mortgage rate table below, except for the muni-bond, the other bond yields and mortgage rate have been declining for the past week or two. Stocks don’t like rising yields and interest rates, so I’m not surprised seeing a big relief rally in the stock market after these yields have backed down a bit. And that is the key phrase to keep in mind; these bond yields have backed off by only a little bit from their recent highs.
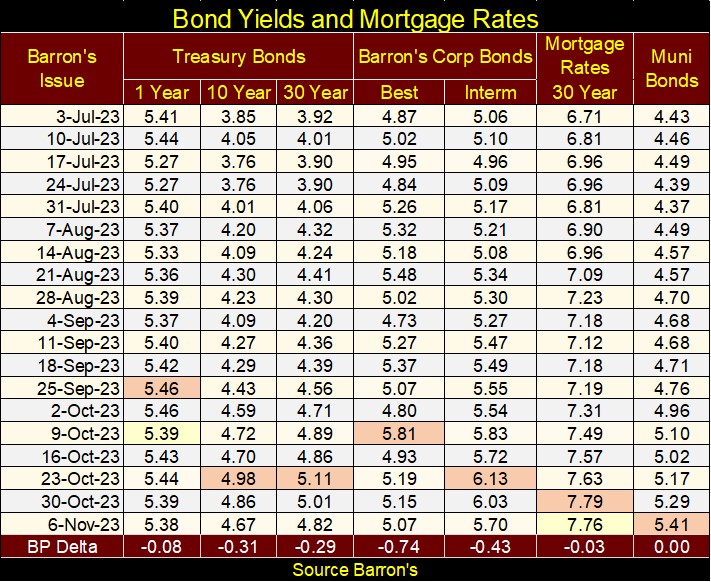
The question in my mind is; what are bond yields and the mortgage rate to do from here? For a larger perspective on this week’s trading, let’s look at my 30yr T-Bond below, issued in February 2020. Since last April, yields have been rising, and valuations deflating. So, it’s not surprising to have yields and rates backed off a bit this week, and we may see even deeper declines in yields before the New Year.
But for the longer term, the American debt market is for dummies, as their common denominator – the US dollar, is going extinct because of the criminal negligence of the people who issue it – the Federal Government, and those who control Washington’s bureaucracies.
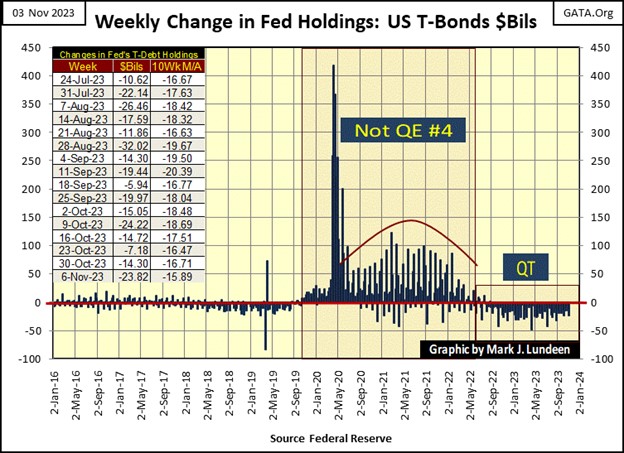
Here is what the idiots claim they did this week; they reduced their balance sheet by selling $23.82 bil of their Treasury debt into the bond market, as seen in the table below.
And its not just the idiots at the FOMC that are lightening their heavy load of T-debt. On a global basis, as seen in the table below, as of last July most countries have significantly reduced their holdings of US Treasury debt, as seen in the Percent From / Max Val column.
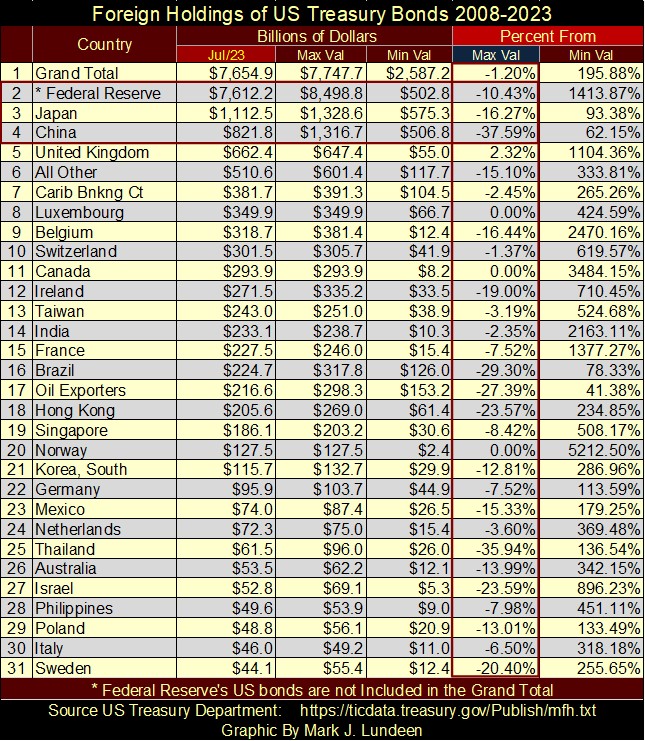
The FOMC, and the majority of nations above are selling T-debt * PLUS * the US Treasury continues issuing new debt by the hundreds of billions of dollars. So, who is buying the T-debt, that all the above are selling in the Treasury market. Where is the buying coming from that caused T-bonds to recover, as they did this week?
Something is not right here; things are being done that are not spoken of, by government officials, or members of the financial media. But then in 2023, there are a lot of things happening that just aren’t right.
The “policy makers” want us to believe our (their) involvement in Ukraine, and now in the Gaza Strip is to defend some overriding international principle, or other high purpose, such as saving the planet. But all this takes money, and lots of it too. In Washington DC, anything worth doing, no matter how unproductive and pointless that “anything worth doing” may be, calls for spending a few hundreds of billions-of-dollars on.
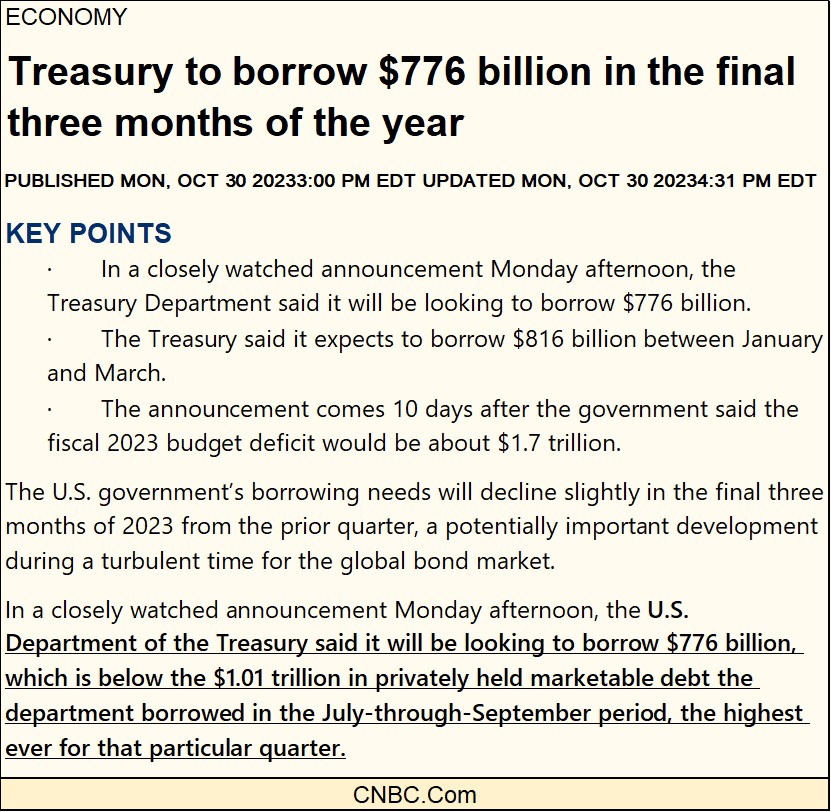
Look at the article below. I’m sure the only principle driving these people, is their all-consuming desire to bankrupt the Treasury of the United States of America, fully aware of the domestic and global chaos that would follow. This mindless spending of hundreds of billions-of-dollars of borrowed money is evil, evil for the harm it will ultimately inflict on a trusting public. That CNBC doesn’t recognize this for what it is, is so typical of the financial mainstream media.
For decades, when hasn’t the US Government funded a war in some God forsaken spot on the Earth, and what good has come from these wars? Its not like it was in the 1940s, where we crushed the Nazis. In 2023, the Biden mis-administration is funding the Nazis in the Ukraine. This war in Ukraine began when Obama and Hillary initiated a coup in the Ukraine, overthrowing a pro-Russian government. Their first step in baiting Putin into armed conflict with Ukraine.
Now we have the war between Hamas and Israel that could any day spillover to the wider Middle East. I support Israel, as the United States has in the past. Islamic organizations, such as Hamas, have admitted they want to finish what was begun by Hitler; the total destruction of the Jewish people.
Hamas doesn’t say that when speaking English, as that is when the main-stream media is covering them. But when speaking in Arabic, Hamas is very precise in stating what their intensions are for the Jewish people, and it’s not limited to Israelis.
I’ll never support that, or those who advocate genocide for the Jewish people. Have no doubt about it, for Hamas, that is what this war is all about.
Now the deep state wants US Naval Assets to strike “terrorist” targets around Gaza and Southern Lebanon? That will only widen this war into an area the United States has no real interests in. This military intervention will only invite other regional powers, such as Iran and Turkey to increase their presence around Israel.
You do realize that none of this would now be happening if President Trump was now sitting in the White House. Which is why the Deep State got rid of him with stuffing ballot boxes in 2020, as they want war and national bankruptcy for the United States. With a cognitively challenged Biden sitting in the White House, someone willing to sign any paper placed in front of him, the deep state is getting all they wanted, and more.
I note how college kids are protesting Israel, again, demanding Israel cease military operations in Gaza. What do these snowflakes find so attractive about Hamas? Predictably, these same kids never demanded a ceasefire in the Ukraine.
This is what happens when a society allows the left to dominate their education system; the left begins indoctrinating that country’s youth into agents-of-chaos. Which is exactly why the deep state spends many billions on what today is confused for “higher education.”
That the left dominates more than just the educational system is proven by the total waste in government finances seen above. As long as the outcome of any task they undertake proves to be futile, they are willing to spend billions and billions of dollars to accomplish the little to nothing the money was spent on; in this case $776 billion for the last three months of 2023. That this $776 billion was less than the original $1,010 billion believed to be required, is not a sign of their integrity with America’s purse strings.
I thought I’d revisit my comments in the US national debt I covered a few weeks ago, but this time with the addition of a new chart, that surprised me at first. But then I understood that to be something predictable.
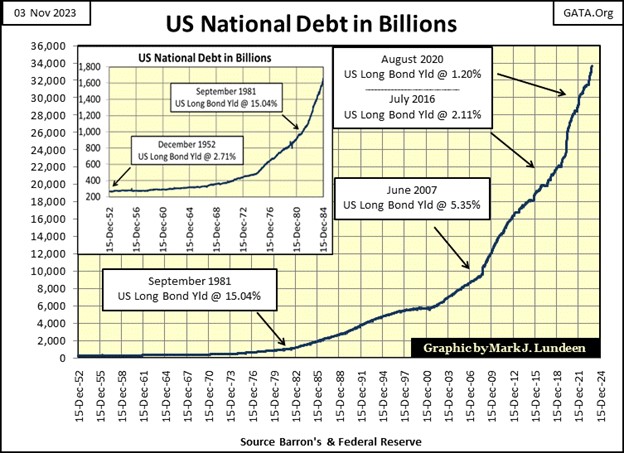
Here it is again, a chart plotting the US national debt going back to 1952, when the national debt was a then massive $267 billion dollars. A sum that is only 34.4% of what Washington intends to spend in the last three months of 2023, a fact that should not make any reasonable person happy.
That the current price of gold and silver are so low, considering the massive debts in dollars amassed below, tell us how effective our system of “higher education” has been in dumbing down generations of American attending colleges and universities. Thanks to our so-called educational system, and the mainstream media, people today really are clueless of the runaway freight-train coming down the tracks – right at us.
Below is the new chart I just plotted; the percentage change in the growth in the national debt on a 52Wk basis. In other words, in percentage terms, how much larger, or smaller the national debt was from 52Wks before. This is spending by Washington’s politicians above, and beyond the tax receipts they receive from the Internal Revenue Service (IRS), and other sources of revenue available to the Federal Government.
From 1956 to 1983, this percentage of deficit spending by Washington only trended higher, peaking in the early years of the Reagan Administration, the same time the stock market began a bull market.
Washington’s deficit spending then trended down, until in the late years of the Clinton mis-administration, there was no growth in the national debt. I remember this period, and this was commented on by the financial media at the time. They attributed this lack of growth in the national debt to the immense flows of capital-gains taxes Washington received from the bull market on Wall Street.
That sounds about right, as beginning with the NASDAQ High-Tech Wreck (Bear Market of 2000 – 2002), once again the national debt, and Washington’s deficit spending began growing.
I have two Red Circles (#1 & #2) in the chart, noting two deficit-spending spikes by Washington. Deficit-spending spike #1 occurred during the sub-prime mortgage debacle, and the FOMC’s QE#1, from September 2008, peaking in August 2009.
Deficit-spending spike #2 (January 2020 to February 2021) occurred during the March 2020 Flash Crash, as valuations for the Dow Jones and corporate bonds began melting down;
- From a new all-time high on February 12th, the Dow Jones deflated 37.09% on March 23rd. A 37% meltdown in blue-chip stocks * IN ONLY * 28 NYSE Trading Sessions. That has never happened before.
- Barron’s Best and Intermediate grade bond yields spiked from 1.88% to 4.01% for Best Grade, 3.06% to 5.37% for Intermediate Grade bonds, in only two weeks. FOMC idiot primate Powell soon announced the FOMC would begin monetizing corporate bonds to “stabilize” the bond market.
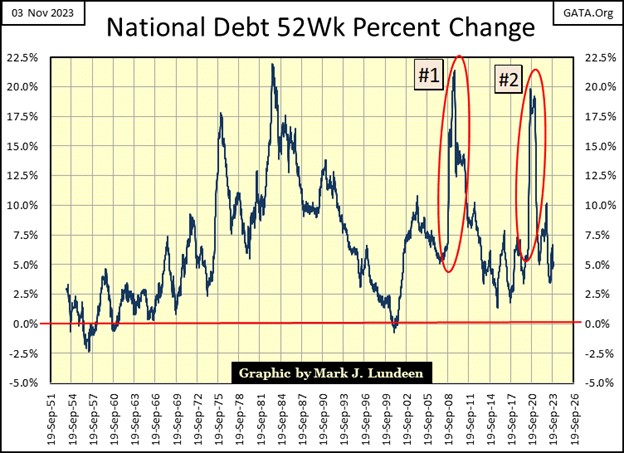
Note how deficit spending spike #1 occurred during Doctor Bernanke’s QE#1, the QE that placed a floor under the stock market collapse in March 2009. Deficit spending spike #2 occurred during Powell’s Not QE#4, which placed a floor under the March 2020 flash crash in stocks and corporate bonds.
So, what does all this mean? I don’t really know, except to verify the fact that the connections between Wall Street and Washington are closely intertwined, to a very unhealthy degree. To the point where Washington is willing to trash the credit worthiness of the US Treasury, should Wall Street require that from Washington’s politicians. How long before we see deficit-spending spike #3 in the chart above, and will America as we know it survive it?
So, what did gold do this week? To answer that, we now go to gold’s BEV chart below.
Currently, not too many people are happy with the way gold is trading. Geeze Louise, it’s been over three years since gold has seen a new all-time high (BEV Zero) in the chart below, and gold isn’t in a hurry to make that happen again, or so that is how it feels like.
But look at gold’s BEV chart below. Since it bottomed below its BEV -10% line in early October, look at how quickly it broke above its BEV -5% line. As far as advances go, gold for the past two months had done darn good for its ungrateful bulls, which I am one.
We’ve seen this before. Since August 2020, twice before gold almost hit its BEV Zero (0.0%) line, the new all-time high line in a BEV chart, only to turn around and go back down. Is gold now going to make this happen for a third time; coming close, but no cigar for the bulls? Until gold actually sees a new all-time high, I’m reserving my right to bitch, moan and groan about gold’s lousy market action.
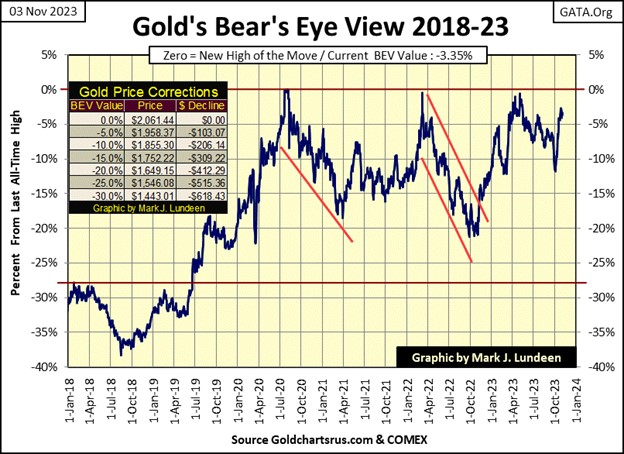
But deep down inside, I prefer to be optimistic. So, I’m expecting gold to make its first BEV Zero since August 2020, in the not-too-distant future, let’s say sometime in the next month. That gold has been closing in scoring position (daily BEV closes between -0.01% and -4.99%) every day since October 18th is worth noting.
As is noting gold closed this week only $69 from its last all-time high. One good day in the gold market would be all it would take for gold to once again close at a new all-time high. And with the world as it currently is, once gold begins making history to the upside, it may begin advancing to levels not believed possible to most people today.
In gold’s step sum table below, following October 19th, selling resumed in gold’s trenches at the COMEX. But even with this headwind, gold advanced from $1975 in mid-October, to today’s close at $1992. Not exactly a stellar performance for gold. But try as they might, the goons at the COMEX failed to force gold to go lower.
What gold, and silver really need is a BIG increase in daily volatility; days of extreme market volatility, which for gold are +/-3% daily moves from previous days closing price, and +/-5% days for silver. For gold, so far in 2023, it has seen only two days of extreme volatility (chart below). Silver has seen only four 5% days so far in 2023.
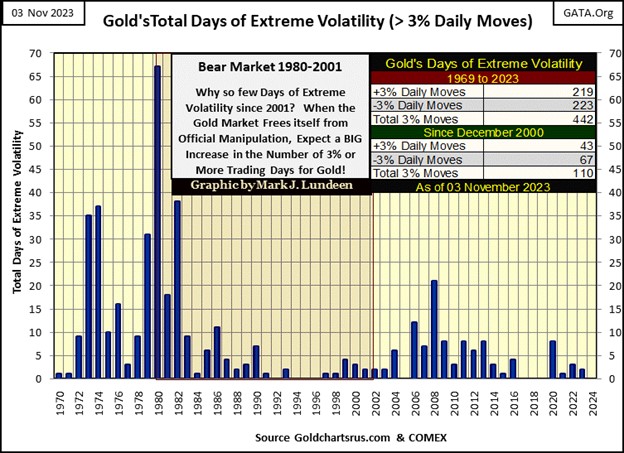
As seen in the chart above, when gold last made a new all-time high in 2020, gold in 2020 saw 8 days of extreme volatility; eight 3% days. Post 2020, that such large daily swings in price for gold and silver have become rare-market events, is a problem for the bulls in the gold and silver markets.
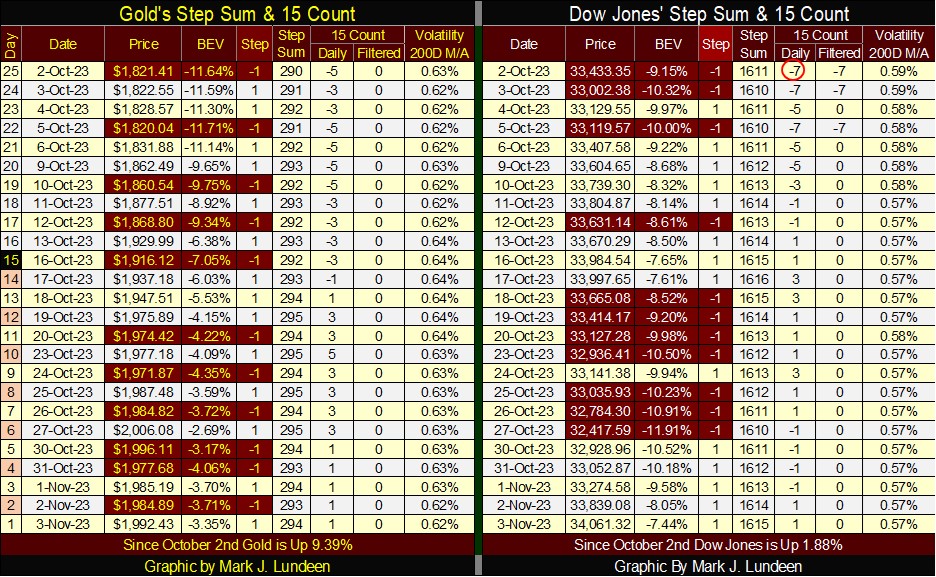
As for the step sum table for the Dow Jones above, what happen this week is on display. Following overwhelming selling in the Dow Jones in the two previous weeks, this week the bulls just began buying on this market weakness. That plus bond yields have come down a bit, something the stock market always likes to see.
So, do the bulls continue to take the market higher? Or, do the bears begin selling into the market strength seen above? I’m thinking the bulls have had their fun. I’m expecting the bears to dominate trading for the next two weeks.
But as my crystal ball keeps getting fogged up, peering into the future for the stock market has become impossible. So, like you I’ll just have to wait to see what happens from here in the stock market.
Here is an ad by Dick Morris promoting Dinesh Dsouza’s latest documentary on America’s growing policy state. I encourage my readers to look at this short video, and maybe purchase a few DVDs of Dinesh’s latest film to pass out to family and friends.
https://www.dickmorris.com/watch-the-police-state-a-new-movie-by-dinesh-dsouza-lunch-alert/
Eskay Mining’s latest press release came out this week, and the market was underwhelmed by it, sending its share price down to $0.22 on above average volume.
https://eskaymining.com/news/news-releases/eskay-mining-confirms-new-precious-metal-rich-vms-6532/
So, what to think about this? Eskay Mining is a precious metals exploration company, that in the past few years has been finding deposits of gold and silver on their vast property. But what the company, and the market expects them to find are high-grade deposits, similar to the old Eskay Creek mine. So far, the company has failed to discover such a high-grade deposit. That does not mean that such a deposit(s) does not exists; as there is good reason to believe they do.
I talked to Mac Balkam (Eskay’s CEO) on Thursday; he’s not giving up on the company. Mac is someone who has children, and he’s counting on Eskay Mining to provide his kids with a comfortable future. Mac has committed a lot of his time and sweat, and personal funds to locate a historic gold and silver ore body on Eskay Mining’s property, and he is not going away.
I’ve known Mac since 2007, where I met him at a mining conference in Chicago, before he took over the company. I’ve found him to be a man of integrity, and I’m comfortable with Mac’s management of Eskay Mining. Given this market’s hostility towards the precious-metals mining industry, Eskay Mining’s shareholders could not have a better CEO protecting their interests in the company.
He is also not going to finance next year’s drilling program by issuing new shares at the company’s current low price. The market for gold and silver miners and exploration companies currently stinks, and he is willing to wait for it to turn for the better.
A better market would be good for Eskay Mining. The core assays for 2023 maybe weren’t what the market was demanding, but they were not all that bad. I don’t know, but I believe the major gold mining companies are still interested in the company’s progress. Gold at $3000, and silver trading over $100 would renew much of the market’s interest in Eskay Mining, and its only a matter of time before we see gold and silver trading at much higher prices.
A lot can happen in six months. So, Mac is going to wait for a better market; higher share prices before he considers issuing new shares to finance next year’s drilling program.
That sounds like a good plan for 2024’s drilling season. So, I’m holding on to my position in Eskay Mining, anticipating better times, higher grade core assays, and share prices in the year to come.
Mark J. Lundeen
********


