Growing Problems in the Mortgage Market


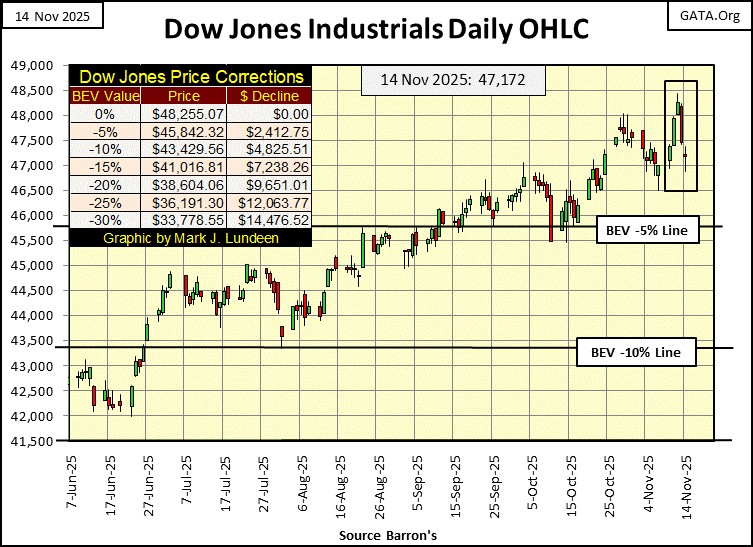
This week, the Dow Jones saw some drama, and new all-time highs on Tuesday and Wednesday. With the Dow Jones in its BEV chart below, closing the week with a BEV of -2.24%, proves nothing got too wild on Wall Street this week. Meaning, for as long as the Dow Jones remains in scoring position in its BEV chart below (between its BEV 0.00% & -5.00% lines), and daily volatility doesn’t see a breakout of the dreaded Dow Jones 2% days, days the Dow Jones closes +/- 2%, or more from a previous day’s close, I’m going to remain positive on this advance in the stock market.

Speaking of rising daily volatility in the stock market, this week the Dow Jones in its daily bar chart below, we did see some increases in daily volatility. Two of these days saw the Dow Jones move more than 1% from a previous day’s close;
- Tuesday +1.18%,
- Thursdays -1.65%.
Even so, until the Dow Jones begins seeing multiple days of extreme volatility, days the Dow Jones moves up or down by 2%, or more, I can’t to get too bearish on this market.
But, being the bear in his closet that I am, the increase in daily volatility seen this week in the chart below, did catch my eyes. Since early July in the chart below, this week’s volatility was greater than any other in the past five months. Is this an indication of things to come? I’ll tell you all about that, a month from now.
Looking at my table below, listing BEV values for the major indexes I follow, this week saw seven new all-time highs, with Wednesday seeing four of these seven. Then came Thursday and Friday, and the market pulled back a bit. Friday closed with fourteen of these indexes within scoring position, closing above their BEV -5% lines (Within the Red Box). But I note the average BEV value of all these indexes (#15), closed the week with a BEV of -5.00%, which is just outside of scoring position.
Is that the hot breath of Mr Bear I’m feeling on the back of my neck? Most likely, no. When Mr Bear returns, everyone will know it, though most will be in denial, and will remain stubbornly bullish in the first phase of a bear market. That is how it always goes.
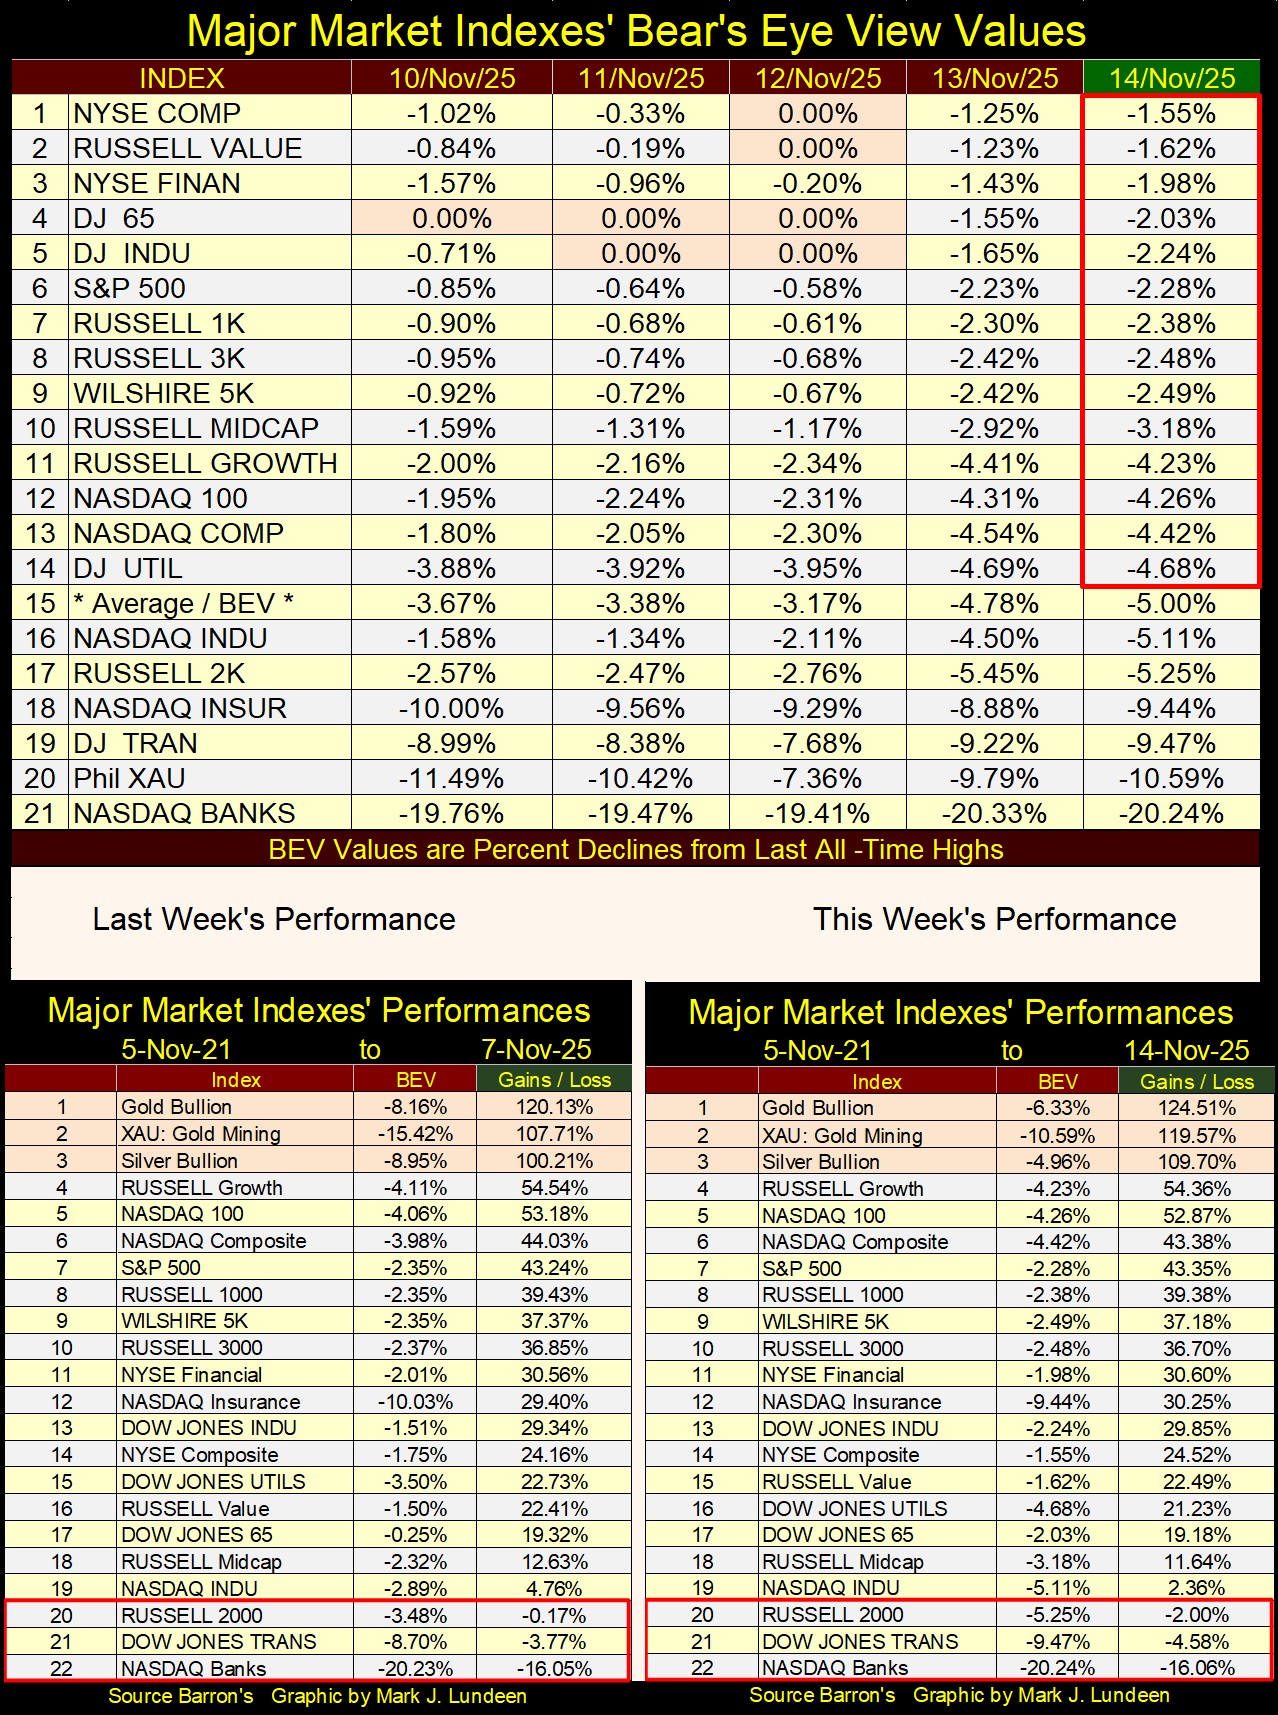
Following gold and silver this week on a daily basis, it felt as if they were under some selling pressure. But in this week’s performance table above, the old monetary metals, and the XAU not only remained in the table’s #1-3 spots, but all were up very nicely from last week’s table. For the most part, everything else not precious in the table above, was down slightly this week.
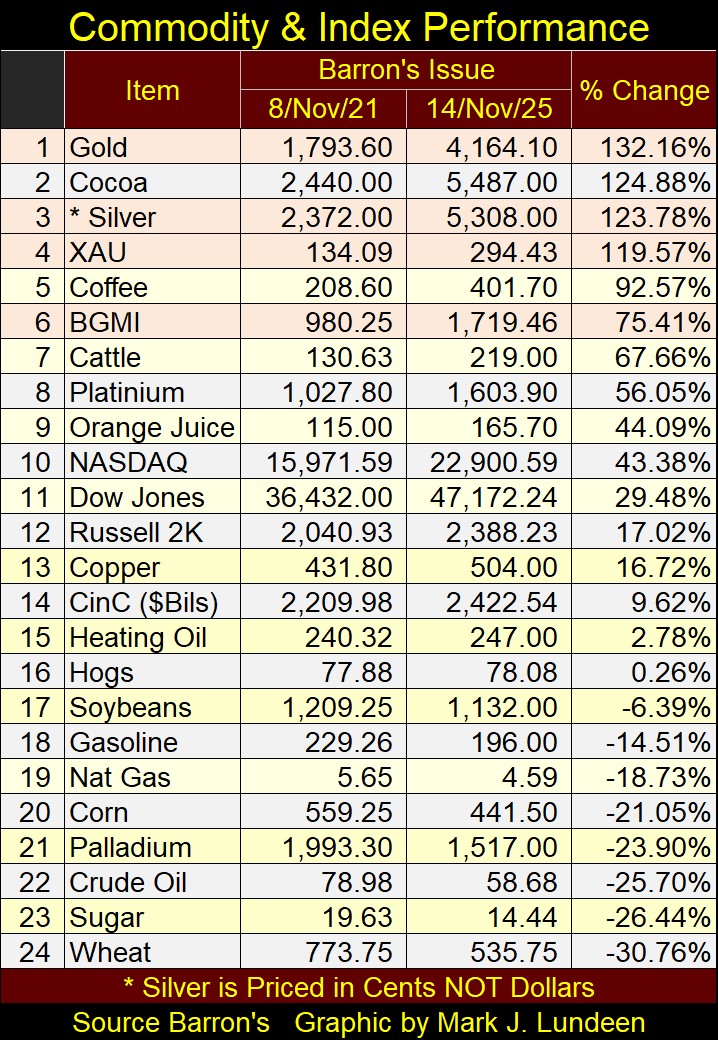
How have these stock indexes above performed, compared to the commodities I also follow in the table below? Since early November 2021, cocoa has done very well, up 124.88% in these past four years. But cocoa is a very volatile market, I’m sure it has popped up to this list’s top ranks several times these past years, to then plunge much farther down, within a few months.
In the commodity markets, most of things have underperformed the stock indexes, like everything from #17, and below, which includes everything in energy. Except for cocoa, coffee, cattle, orange juice, and copper, none of the other commodities in the table below have risen by double digit percentages these past four years.
So, how did consumer price inflation get out of control in recent years, when so many of the commodities seen below have actually fallen since November 2021? Don’t blame the farmers, or the stores we purchase food in. I’m thinking it’s the middlemen in the food system. Big corporations that form the big invisible box, that lies somewhere between the farmers’ fields, and the shelves in our stores.
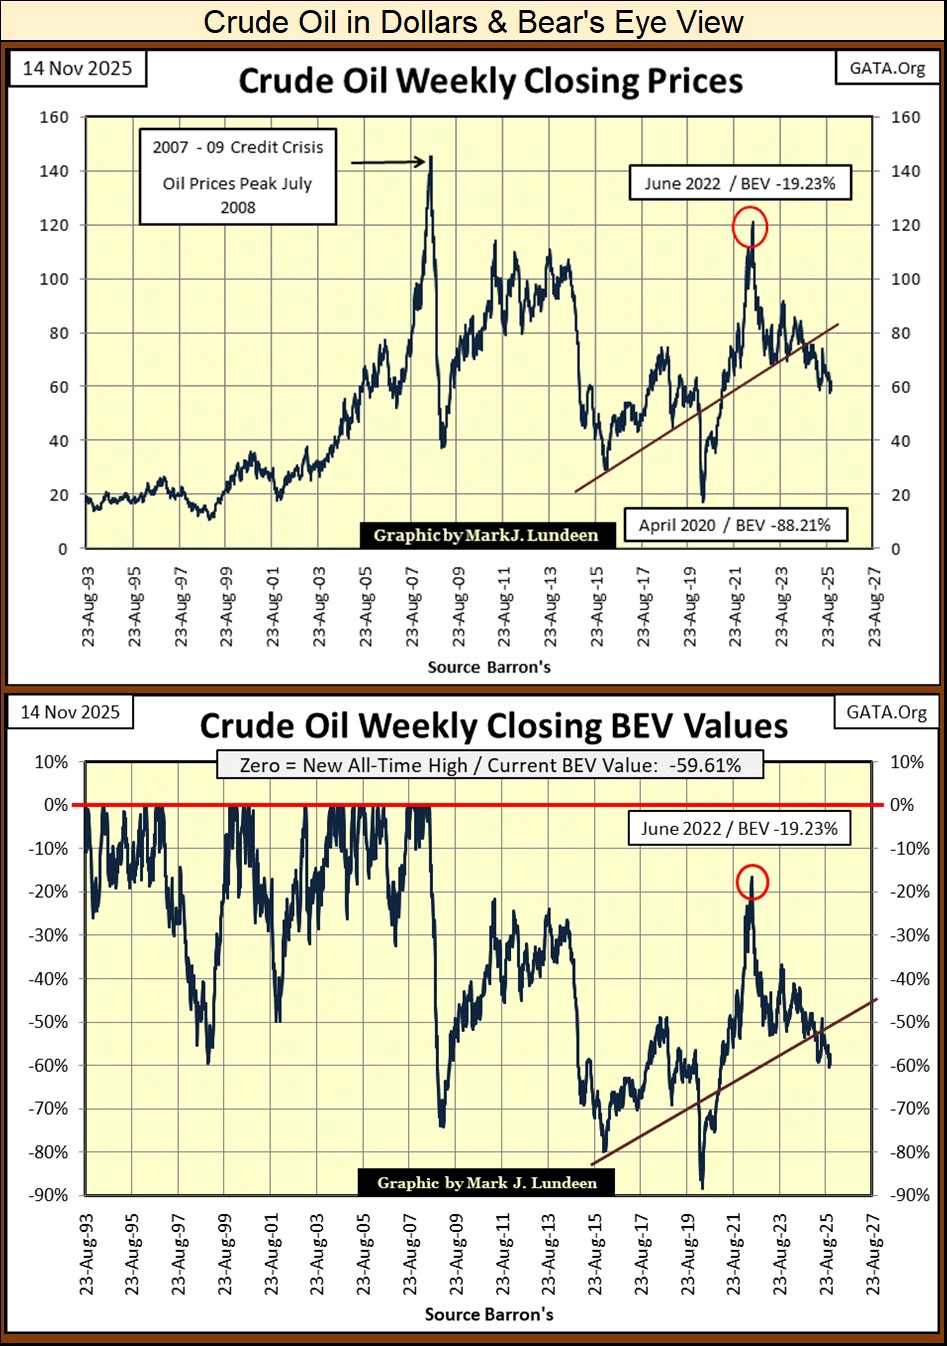
Let’s take a look at crude oil in the chart below. My commodities prices are actually from Thursday’s close, as I have enough to do on Friday writing my weekly articles. But on Thursday this week, a barrel of crude oil went for $58.68. As there are fifty-five gallons of oil / barrel, that is $1.07 for a gallon of crude oil, much less than a gallon of fancy spring water sold at the supermarket.
When someone with any intelligence considers the human effort, and colossal capital investments required to first discover, and then extract crude oil from deserts, under the sea, or in malarial infested jungles, and the difficulties in shipping crude oil from where it’s found, frequently in the middle of nowhere, to the refineries for processing it, and from there to the market place; seeing crude oil sell today for $1.07 a gallon, and gasoline for $1.96 a gallon at wholesale, are things I find amazing.
God bless capitalism! You commies out there couldn’t do this. Though since Lenin took over Russia in 1917, you guys have tried many times, and failed every time you attempted to. A world managed by a socialist model, is a hungry world, a world lacking the basic elements of civilization, like soap and clean water. Forget about buying gasoline at $1.96 a gallon at wholesale.
If I ran the energy market as my personal empire, those ANTIFA rioters would be paying $100 a gallon for gasoline, just to keep them stuck in their mothers’ basement, to keep them from setting fire to Portland and Chicago.
Below, bad news from the residential real estate market.
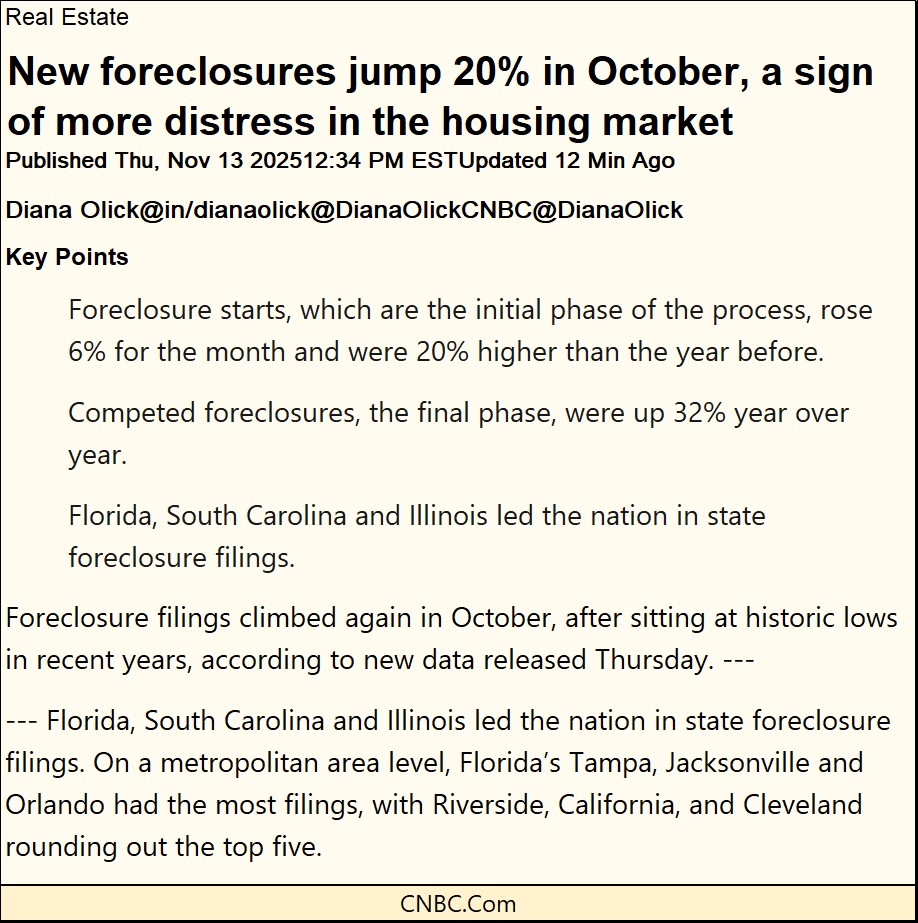
https://www.cnbc.com/2025/11/13/foreclosures-rise-october-housing-market-distress.html
They never fixed the real estate market following the 2007-09 sub-prime mortgage debacle. Instead, in 2009 they merely “stabilized” deflating real estate valuations with Doctor Bernanke’s QE-1, soon followed by the QE-2&3. Comrades of the idiots at the FOMC, then rewrote Wall Street’s accounting standards, where “deeply-discounted-debt assets,” could be accounted for at their face values.
Besides the massive public relations effort, where “market experts” began seeing nothing but “green shoots” sprouting in April / May 2009, from sea to shining sea, that was all it took;
- a few hundred-billion dollars of monetary inflation,
- and some fraudulent alterations in accounting standards,
to “restore” the financial system in 2009.
It must be nice to have friends in high places. And for a few decades, it was. But things are once again beginning to fall apart in the mortgage market.
Now in 2025, Mr Bear is once again paying residential real estate a visit. In the video below, home prices in Colorado’s world-famous skiing towns are in a free fall. In Colorado’s winter wonderlands, real estate valuations have become so distorted, these cities’ middle class were forced to live somewhere else.
These towns, shops, restaurants, and hotels are losing the staff required to operate them, because the middle class can’t afford to live there. This is not good for the valuation of the also mortgaged retail space in these towns. For the weekend Colorado skiing trade, for out-of-state tourists, amenities from the local hotels and shops will become fewer, and more expensive.
https://www.youtube.com/watch?v=brb_zuJsdaI
These current mortgage difficulties in Colorado, and to be sure elsewhere too, are only the latest manifestations of the old problems from the 2002-2007 real estate boom; the financial systems’ ability, and willingness to “inject” funds into the mortgage market are unlimited.
Next week, a bank near you could, they won’t, but they could write a $2,000,000 second mortgage on your house. For them, that easy; they need only write $2,000,000 on a check with your name on it, then get you to sign the contract for the monthly mortgage payments, and it’s then a done deal.
Unfortunately, the ability most people to service the above $2,000,000 first or second mortgage, is very much limited to the income they can generate. So, at the top of a real estate bubble, marginal “home owners” begin defaulting on mortgages they should have never have been afforded. Following that, market gravity takes over, as market valuations come tumbling down in an avalanche.
Readers of my articles have known all this for many years. It seems these Colorado skiing towns are now learning that, the hard way.
One possible solution to the above problem would be a longer-term mortgage, which would lower monthly payments. Then this week, President Trump is instigating a 50-year mortgage. Is that a good idea?
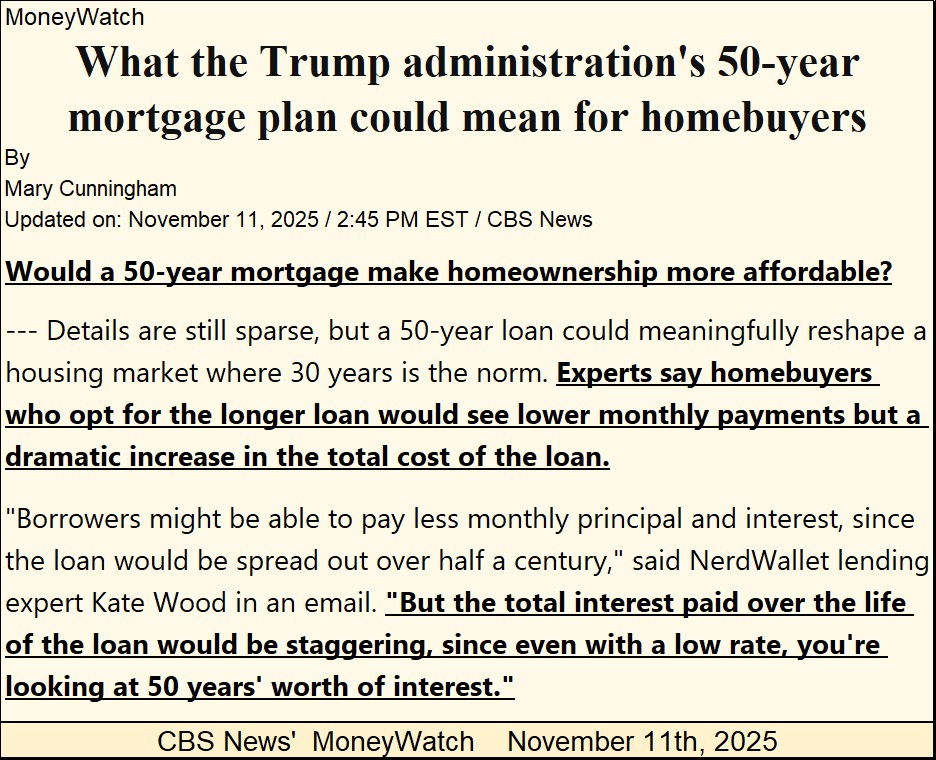
https://www.cbsnews.com/news/trump-50-year-mortgage-loan-bill-pulte-cost/
For Trump the businessman, in his commercial real estate dealings, I would say a 50-year mortgage, if available, would most likely be the logical choice. The monthly service payments for a 50-year mortgage, compared to a 30-year mortgage is considerably less. If Trump was financing a new Trump Tower, planning to sell 90% of the units in the next three years at a considerable profit, to pay off its 50-year mortgage, forty-seven years early, a 50-year mortgage is the only way to go.
But for most people, purchasing their home via a 50-year mortgage is a horrible idea. For someone purchasing a home when they were twenty, the prospects of finally paying off their mortgage when they were seventy is abusive.
One must keep in mind what the actual differences between a 30-year, or 50-year mortgage monthly payments are, for mortgages of equal principal and interest rate. Every month, each pays exactly the same amount of interest payment. No way to get around that. But note; the 30-year mortgage’s monthly payments are higher, because each month, the 30-year mortgage is retiring a significantly larger proportion of the principal on the mortgage. With a 50-year mortgage, for the first twenty years of its debt service, almost nothing of the principle would be paid off.
But the same is true when comparing a 20-year, to a 30-year mortgage. The monthly payment for each, has the same monthly payment to service the mortgage’s interest burden. But each month, the 20-year mortgage pays off a higher proportion of the principal, than does the 30-year mortgage.
What about a 10-year mortgage? Yes, what about a 10-year mortgage? Oh, the banks don’t like 10-year mortgages, but you should! Unfortunately, because everyone else is leveraging their monthly payment, and home valuation with a 30-year mortgage, 10-year mortgages have never been popular for the reasons seen below; much higher monthly payments for the same house.
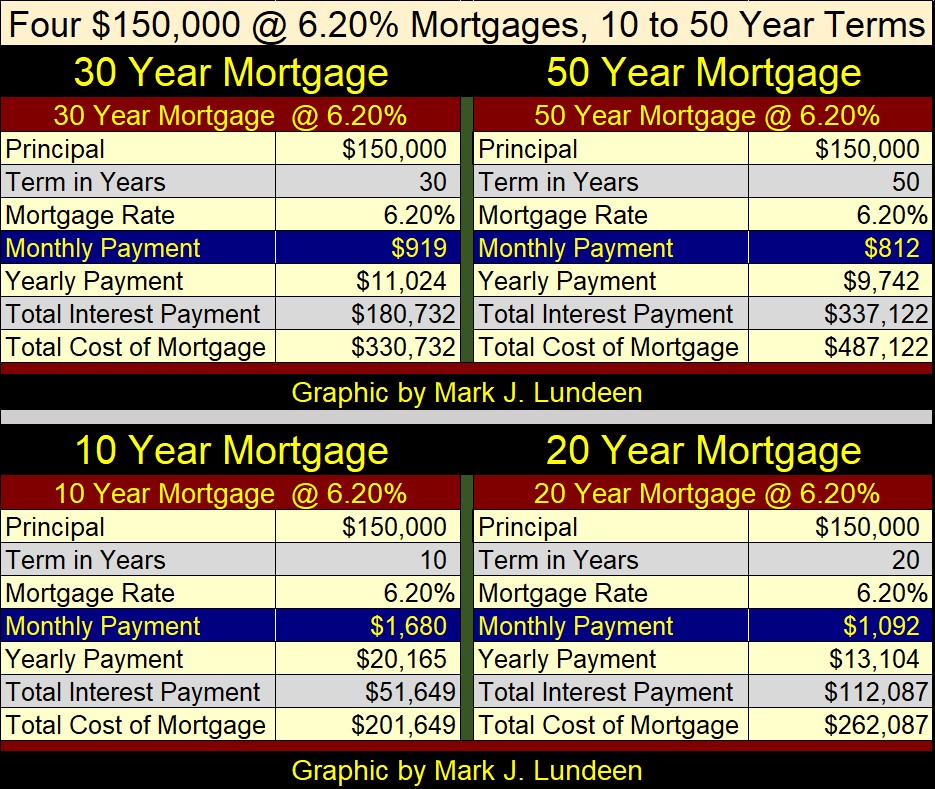
For a $150,000 mortgage, with a rate of 6.20%, the monthly payments per term are;
- 50-year $812
- 30-year $919
- 20-year $1,092
- 10-year $1,680
So, the 10-year mortgage’s monthly payment is twice that of the 50-year. But note, the additional monthly payment is going towards pay off the mortgage’s $150,000 principal. Now look at the total cost differences between the 10-year and 50-year mortgages; $286,000. This is money that would be available for the homeowner with the 10-year mortgage, to do something else with for the next forty years, besides paying off the 50-year mortgage in this example. Like I said, banks don’t like 10-year mortgages.
Currently, American banks don’t write 50-year mortgages. Though I do recall during the Japanese real estate boom of the 1980s, intergenerational, 100-year mortgages were then popular in Japan.
What a legacy that would be for your children, and grandchildren; legally bind the unborn to service a mortgage from the 1980s. I hope I don’t have that correct, as that is a monstrous thing to do to people. The 1980s was a long time ago, and memory fades with the passage of time. But the banks would love a 100-year mortgage, if the politicians would let them get away with it.
If President Trump gets his 50-year mortgages instituted within the mortgage market, the financial industry will push them on a trusting public, noting the “big savings” in monthly payments. For good reason, they believe the public is totally ignorant, of the birds and the bees in making a mortgage. And don’t expect the bankers to explain to young people, the ins, and the outs of how their mortgage was born.
But a 50-year, or even a surf-dependent, intergenerational 150-year mortgage isn’t the solution to our current problems in the housing market, a housing market that excludes too many people from affordable housing.
As a baby-boomer myself, I’m taking personal risks stating the obvious, as I do below. I fear I’ll be taking my daily walk down the parkway, clutching my trusty walker as I go trucking on down the line, when a crowd of my fellow old geezers will recognize who I am; the guy who said the following. In a state of rage, with canes and walkers raised in anger, they’ll rush me for a lynching. But I don’t care, because I’m going to speak truth to the totally ignorant here.
The American real estate market needs another Great Depression in real estate valuations, to drive down home prices by 90%, or more. The reason this is now necessary, is for the same reason it was required following roaring 1920s; the idiots at the FOMC, inflated a huge bubble in property valuations. What was not available in 1929, was amply available in 1939; affordable housing for working class Americans. I say this knowing what happened between 1929 and 1939; the Great Depression.
In 1954, the middle-class could buy a home for $10,000, see quote below. Many of these same houses are now valued well above $150,000, even with their now bad plumbing and leaky roofs.
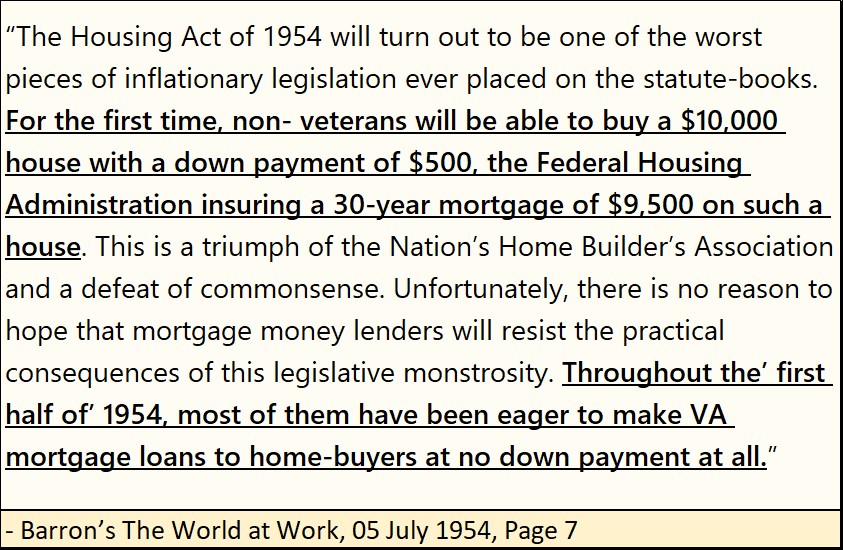
This pending downward adjustment in property valuations will be a brutal process, as is always the case when all inflationary booms finally go bust. But this deflationary adjustment is a necessary one, if younger people once again, are to have an opportunity for affordable housing.
But Washington, Wall Street, and the old geezers in my part of town, will fight Mr Bear on this, with new legislation from Congress, and another QE from the idiots at the FOMC. Ultimately, they will lose. But not before they make things in the real-estate market, much worse than they already are.
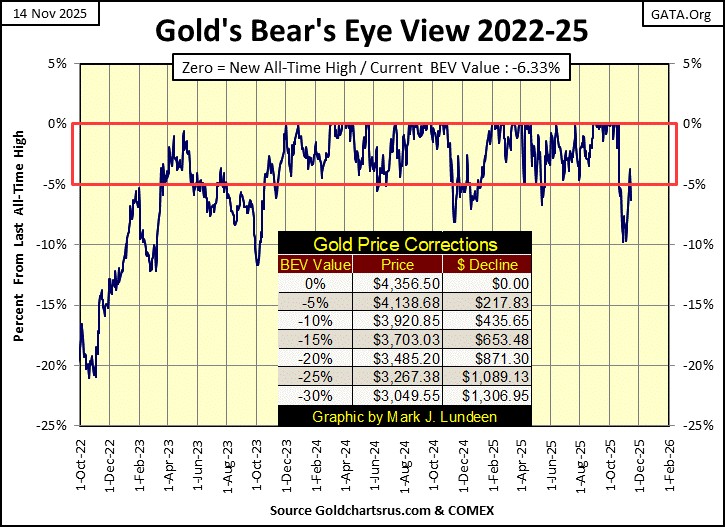
After that, I need some cheering up. So, we now go to gold’s BEV chart below. Gold last week almost broke below its BEV -10% line, but bounced back nicely this week. On Wednesday, and again on Thursday, gold closed inside scoring position, but broke below its BEV -5% on Friday’s close.
One of two things is likely to happen in the coming month; either gold will once again attempt to close below its BEV -10% line, or make another attempt at closing at a new all-time high, or a BEV Zero in its Bear’s Eye View chart below. I’m of the mind; a new all-time high is the most probable outcome in the coming month.
Should some crisis become public knowledge in the debt markets, the current bull market in gold and silver could become explosive. With the idiots at the FOMC in full control of our financial system, we can trust there are many pending crises, waiting for the public to become aware of. In such a world, owning gold and silver, financial assets with zero counter-party risks, is the smart choice for independent minded investors. Don’t forget the precious metals miners.
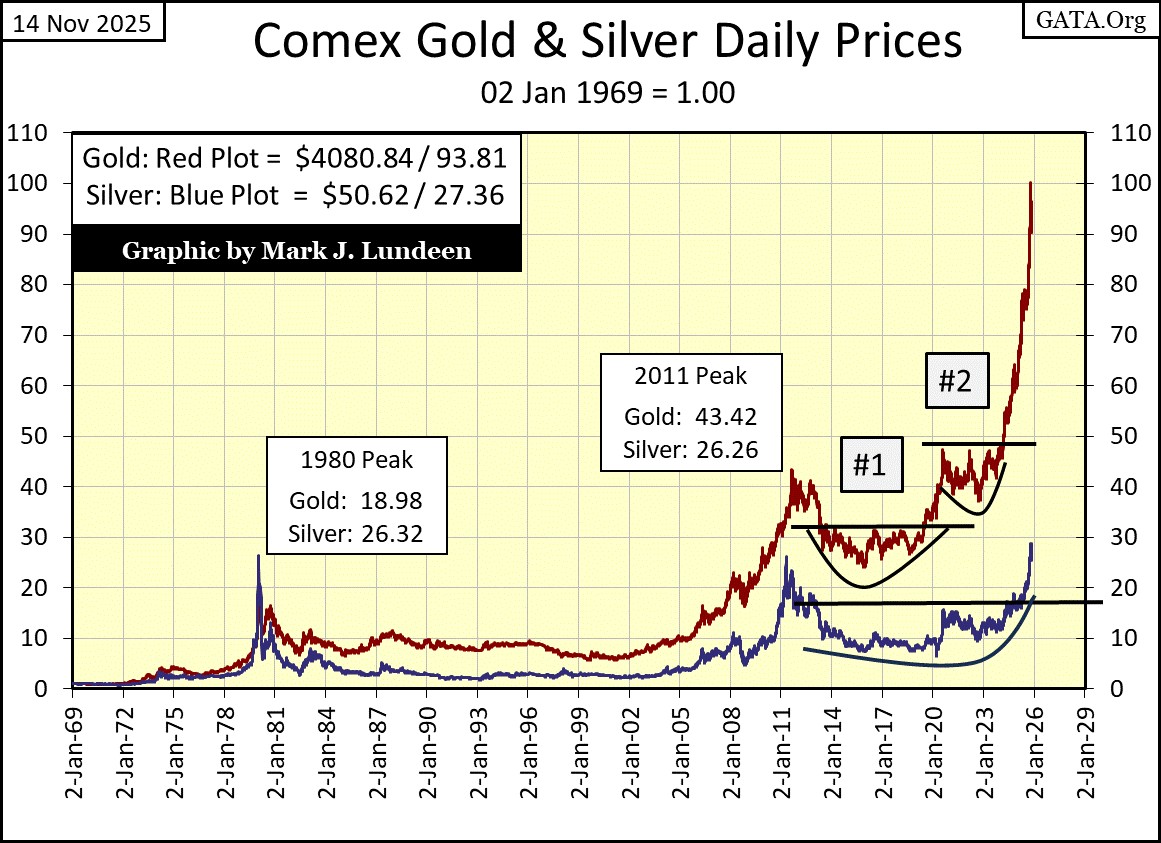
Moving on to my chart plotting the indexed values of gold and silver below, their advances of 2025 are on full display. Seeing massive advances like these, we should anticipate temporary price corrections to the downside. Something I have to note, we have not seen in this chart for the past few years. What’s with that?
What’s likely to next happen from gold and silver’s current highs? Being honest, they are both well past due for a significant correction in price; a 20% to 25% pull back from their last all-time highs. Still, being honest with my readers, should gold in the next few weeks close above its 110 line ($4785), and silver above its 40 line ($74), I could live with that.
In gold’s step sum table below, gold is currently correcting from its extremely overbought 15-count of +11, seen on October 16th. As expected, daily declines in the gold market have increased since the gold market saw that 15-count of +11 a month ago. However, I note for all those down days seen in the table, the most the bears could drive the price of gold down to was a BEV of -9.78%, or a 9.78% decline from gold’s last all-time high on October 29th.
Since gold’s last all-time high (Blue BEV Zero) on October 20th, down days have dominated trading in the gold market. Plenty of down days to drive the price of gold well below a 10% decline from its last all-time high.
* But that didn’t happen. *
Since gold last all-time high on October 20th, gold hasn’t broken below its BEV -10% line. Apparently, the price of gold doesn’t want to go down below its BEV -10% line, and then this week, twice gold closed in scoring position.
Currently, the gold market is seeing more declining, than advancing days, without as much impact on the price of gold as one may believe so many down days would have on it. This selling may have topped when gold’s 15-count hit an oversold -7 on November 6th. Since then, in the past week, gold once again began seeing more daily advances than declines. Possibly, gold has entered a period where advancing days will overwhelm daily declines. If so, we’ll see what the price of gold does then.
Gold’s daily volatility’s 200D M/A closed the week at 0.95%. Rising daily volatility favors the bulls in this market.
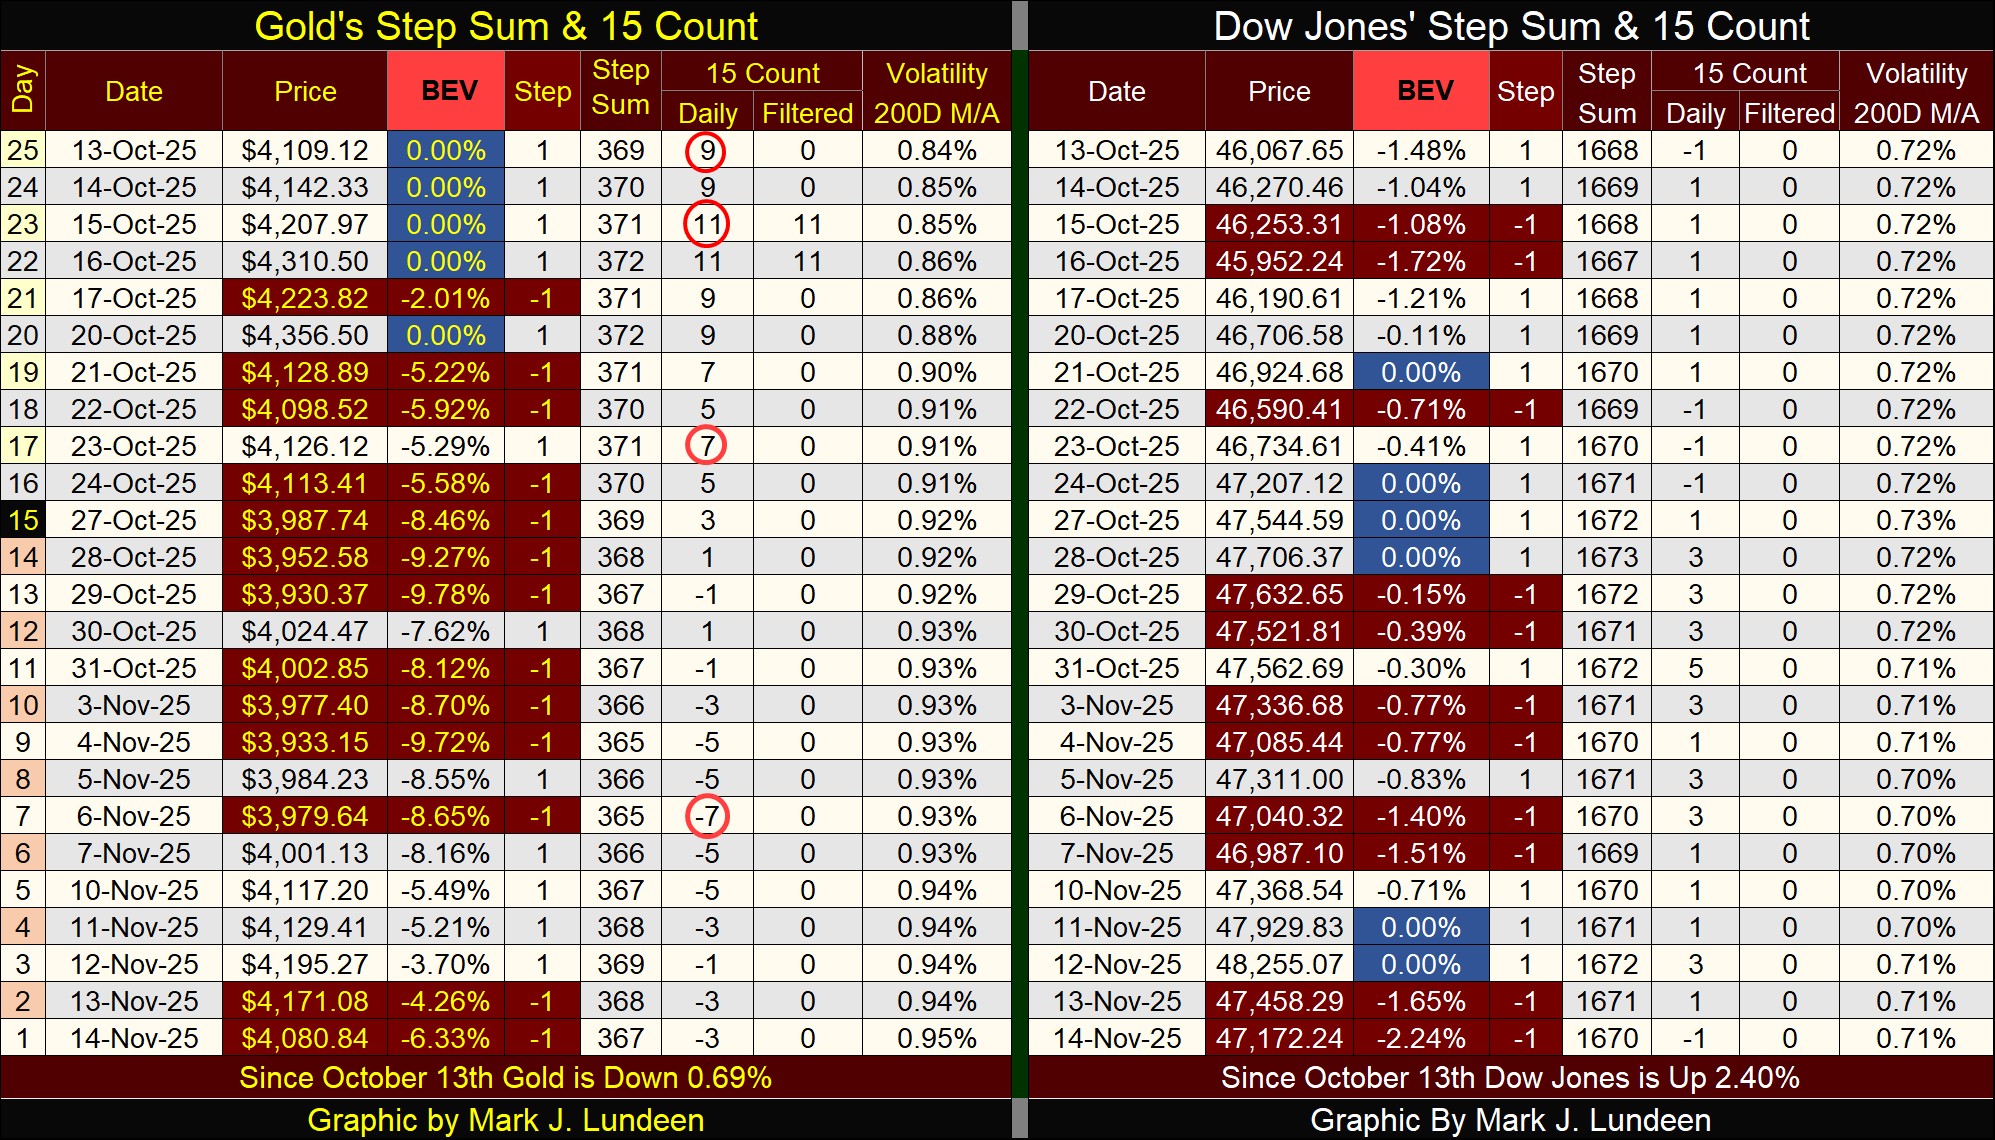
The Dow Jones on its side of the step sum table looks really bullish. Since October 28th, the Dow Jones has seen more daily declines than advances, yet the bears failed to push the Dow Jones out of scoring position, below its BEV -5% line. And since the end of October, even with all those daily declines seen above, the Dow Jones this week saw two new all-time highs, on Tuesday and Wednesday.
I remain long-term bearish on the stock market. But looking at what is seen above for the Dow Jones, on a short-term basis, the stock market has yet to see its ultimate highs for an advance that began in August 1982, when the Dow Jones last closed below 800, at the inverted-green triangle in the chart below.
And what a chart this is! This is what happens when Congress legislates a central bank to control credit creation in 1913, and 112 years later we see these idiots do this to the Dow Jones.
Below we see the Dow Jones’ three major bull market tops of the 21st century;
- January 2000 / NASDAQ High-Tech Top; 11,722,
- October 2007 / Sub-Prime Mortgage Debacle Top; 14,164,
- Date Unknown / The Bubble Top That May Destroy the World; >50,000?
Each of these bubble tops were inflated into the financial markets by the idiots at the FOMC, and #3 completely overwhelms their first two bubble tops. As it is said; with practice comes perfection.
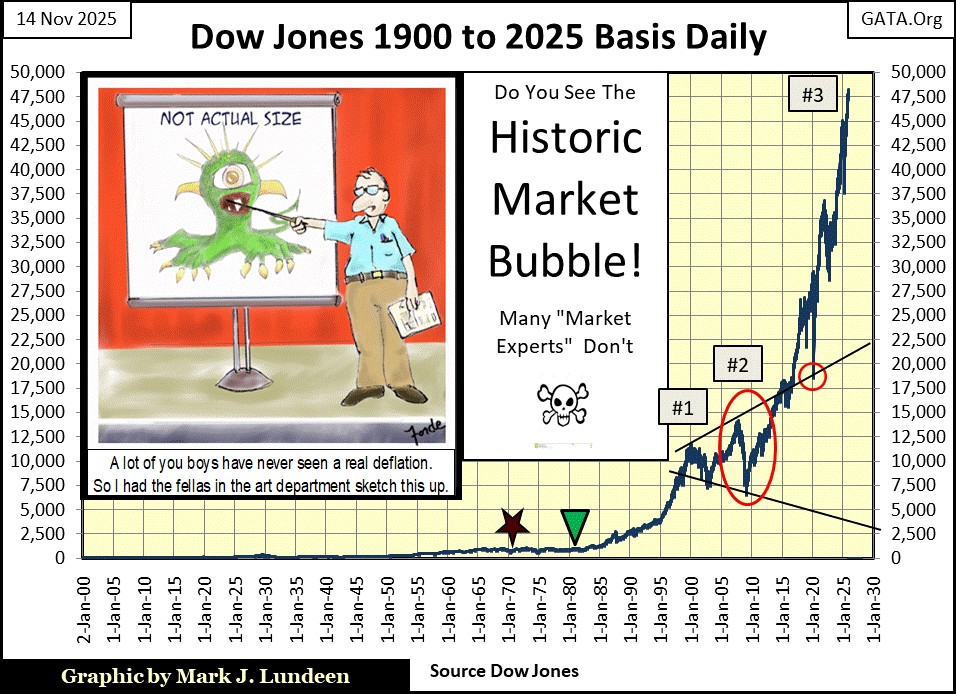
Every time the Dow Jones sees a new all-time high, on its way to break above 50,000, I want to go into my bedroom, and sit in the dark for a few hours. Because I know this isn’t a bull market, it’s a weapon of mass destruction sitting in the middle of the financial system that enables the world around me to function.
When this bubble in the stock market, and in Colorado’s winter wonderland real estate market finally comes crashing down, it will be horrible. Do yourself a favor; get some gold and silver bullion for the bad times to come.
Have you been following the travels of the interstellar comet 3i/Atlas, and the new discoveries made by the James Webb Space Telescope? I have, and they are amazing.
The knowledge of the universe science has learnt since Galileo first pointed his telescope at the moon in the 17th century, to see it had mountains and valleys on it, is astonishing. And now with the James Webb Telescope, science is now searching the edges of the knowable universe, to see what is there.
I like science, to better understand the physical world I live in. But the thing I have to keep in mind is; the scientists who discover all these wonderful things are people, and people, including the idiots at the FOMC, and yes, you and me, are all flawed beings. It’s just the way we are.
There are things scientists know about, but for reasons known only to them, refuse to share their esoteric knowledge with the public. A good example of this would be UFOs. After seven decades of denials, “science” is finally admitting there is actually something real about UFOs. Meaning; “science” is very much willing to deny and lie to the public about – all kinds of stuff.
With that in mind;
- that 21st century science doesn’t know it all,
- and sometimes “science” knows things they aren’t going to share with us,
below is an interview of Timothy Alberino, by Glen Beck. The video is an hour long. An hour that may be your best spent hour in the week to come.
https://www.youtube.com/watch?v=e0v6Xbq2RB0
Mark J. Lundeen
********


