Hard Landings Recession Predictions Wrong


For over a year now the main topic of discussion has been regarding the likelihood of a “hard landing” versus a “soft landing” for the US economy — based on the actions of the Federal Reserve, which controls the money supply and interest rates.
These are the tools the central bank uses to keep the economy running near full employment, and inflation in the neighborhood of 2%, a kind of “Goldilocks zone” wherein the economy is neither growing too fast, fueling higher consumer prices, nor too slow, which can stall economic growth and result in layoffs.
Since March 2022, the Fed has been working to control inflation that at one point was the highest in 40 years. They’ve been doing this by raising interest rates in increments from nearly zero to +5%. In June the Fed paused its rate-hiking but on July 26, they raised the federal funds rate another quarter percentage point, to 5.5%. No more rate increases occurred over the next three monthly meetings.
AOTH’s interest rate predictions have been bang on
I’ve been right in my prediction that the Fed would pause in June, and hike once or twice more before the end of the year.
I’ve also voiced my opinion that we get a soft landing with no, or an extremely shallow and very short recession, with the important proviso that the Fed pauses its rate-hiking cycle, which it has already done. For the Fed this means the inflation rate is coming down. Remarkably, the Federal Reserve has raised interest rates fast enough, and quick enough, to reverse the inflation rate, without causing a severe downturn. And it’s done it in an extremely short amount of time.
Despite these facts, it seems most believe a hard landing and a recession is coming, and they base their opinions on a few key economic indicators. They presume these indicators are right because they have been historically. But what if they’re wrong because this time is different? A fair chunk of research by yours truly reveals this is exactly what is happening. Theres plenty of reasons to believe the current indicators predicting a recession are broken this time around and this article sets out to prove it.
Recessionistas
As an example of those who believe we are rushing headlong into an economic contraction — a recession is typically defined as a fall in GDP for two consecutive quarters — look no further than Crescat Capital.
The firm states that, Despite the growing popularity of the soft-landing narrative, the current scenario presents a multitude of macro factors forewarning a major recession.
Crescat believes there is a “dangerous disconnect” between highly inflated financial asset valuation within a tight money environment. It therefore thinks the US economy is “teetering on the brink of a downturn, the broader equity market is now at risk of a violent selloff.”
Moreover, Crescat’s macro model encompassing 17 indicators is “now at one of its most alarming levels in the data record,” with “nearly all indicators having reached historic extremes, corroborating our perspective on the high risk of an impending hard landing.”
The Speculative Investor is another on board the recession train, justifying their call on the rise in Continuous Claims for Unemployment Insurance. Claims bottomed in September 2022, moved higher into April of this year, and just confirmed an upward trend by moving above its April high. “This is consistent with our view that a US recession will begin before the end of this year, although based on the historical record the recession start date won’t become official until the second half of next year.”
Bloomberg thinks the situation is more of a mixed bag. Despite manufacturing slumping, and businesses paring spending as global demand slows and the US-China trade war rages, unemployment is near a five-decade low, stock prices remain elevated and interest cuts are expected in 2024. In color-coding a selection of key indicators, Bloomberg finds that jobless claims, consumer spending, credit conditions, and average weekly hours, are all in the green.
The housing markets, where sales have stagnated and single-family home permits have cooled since 2018, is flashing yellow, as are equipment orders, where bookings for non-military capital goods excluding aircraft have been slowing since the end of 2017.
In the yellow-red category are the yield curve, manufacturing and profit margins. The spread between 3-month and 10-year Treasuries has been inverted for the past four months — a classic recessionary signal that we will visit below — manufacturing contracted in August for the first time since 2016, and corporate profit margins have fallen to levels not reached since the US was emerging from the last recession.
“[Companies are] getting squeezed,” said the chief US economist at Societe General SA. “When they’re experiencing very thin margins, their anticipations on profitability begin shrinking and they — as a result — tend to cut back or scale back their plans for investment, scale back their plans for hiring.”
Color me skeptical.
Four recession indicators
The crux of the matter is that a few well-known recession indicators have been flashing red for over a year now. The US economy remains in fine fettle, with unemployment at or near record lows, the main US stock indices buoyant, and despite high inflation and higher interest rates, robust consumer spending and corporate profit-taking. We wanted to find out why the traditional recession indicators have been wrong. Below are the results of our research.
LEI
The “Leading Economic Index” (LEI), published monthly by the Conference Board, is a leading indicator for turning points in the business cycle. It successfully predicted the 2001 dot-com recession and the financial crisis.
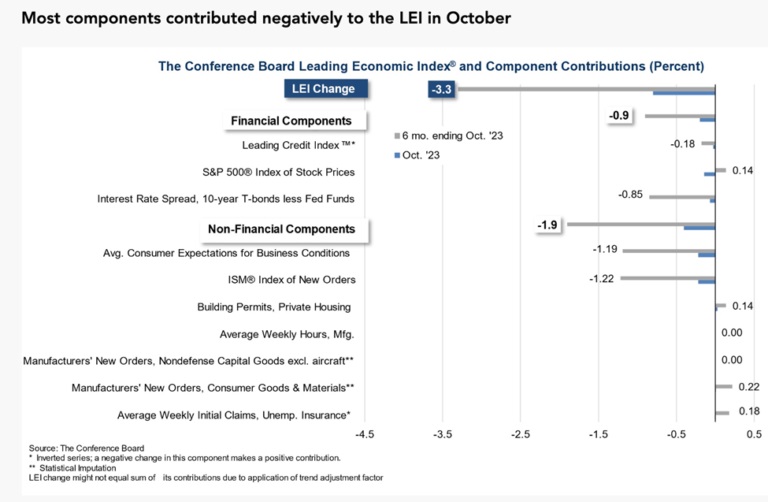
The LEI consists of 10 components: average weekly hours in manufacturing; average weekly initial claims for unemployment insurance; manufacturers’ new orders for consumer goods and materials; ISM index of new orders; manufacturers’ new orders for nondefense capital goods excluding aircraft orders; building permits for new private housing units; S&P 500 index of stock prices; leading credit index; interest rate spread (10-year Treasury bonds less federal funds rate); average consumer expectations for business conditions.
On Nov. 20 the Conference Board released its LEI report for October.
It said the LEI fell by 0.8%, to 103.9, following a decline of 0.7% in September. In the six months between April and October 2023, the LEI fell 3.3%, compared to -4.5% during the same period in 2022.
“The Conference Board expects elevated inflation, high interest rates, and contracting consumer spending — due to depleting pandemic saving and mandatory student loan repayments — to tip the US economy into a very short recession. We forecast that real GDP will expand by just 0.8 percent in 2024,” said the Conference Boards’ senior manager, business cycle indicators.
The problem here is the Conference Board has been predicting a US recession since first outlined in its August 2022 LEI report. The recession was supposed to start in late 2022 or early 2023. It failed to materialize. The LEI continued to predict a recession in mid-2023 and late-2023.
None of these recessions that were forecast to ply the land since late 2022 have actually occurred. On the contrary, “Real” GDP” (GDP adjusted for inflation) jumped by an annualized rate of 4.9% in Q3 from Q2, following the 2.1% increase in Q2 and the 2.2% increase in Q1.
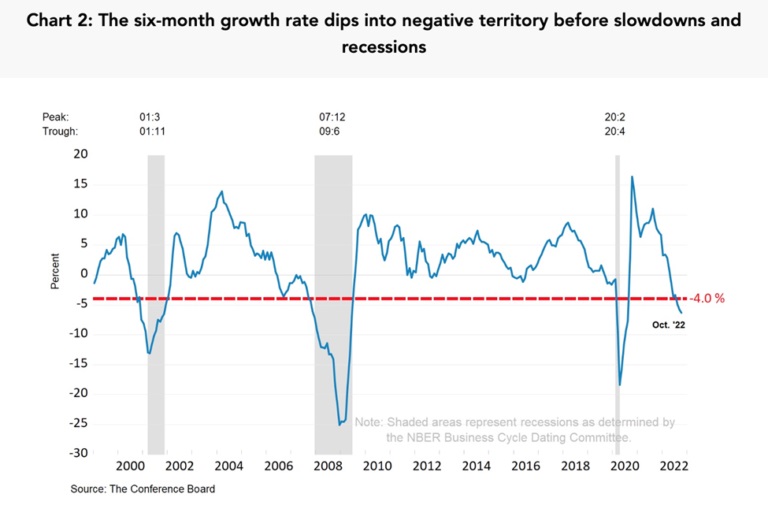
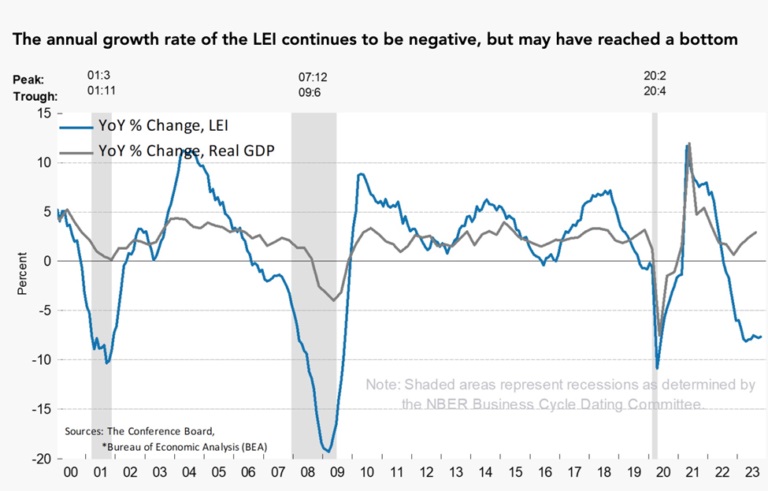
Forget about GDP for the moment. The LEI typically peaks about a year before a peak in the business cycle, seen below in Chart 1. This means we can forecast when a recession might occur. According to the Conference Board, the LEI peaked in February 2022 and has been trending downward ever since. But while the growth rate of the LEI continues to be negative, the Conference Board suggests it may have reached a bottom.

Source: The Conference Board
While tracking the six-month change in the LEI is a good way to assess whether a recession is coming, the Conference Board admits the indicator isn’t perfect. Indeed, negative growth rates have occurred seven times since 1959 without a recession starting shortly afterwards.
“This just goes to show that just looking at the index growth rate alone could give false signals and predictions that may not always be accurate,” admits the Conference Board, which invented the LEI.
Source: The Conference Board
Source: The Conference Board
Source: The Conference Board
We can also look at another recession indicator, called the Conference Board Coincident Economic Index. The CEI tracks payroll employment, personal income less transfer payments, manufacturing and trade sales, and industrial production. The October data here isn’t as gloomy as the October LEI. The board says the CEI was unchanged in October at 110.8, and is now up 0.9% between April and October 2023, compared to 0.4% growth over the previous six months. Three out of four index components advanced in October.
Inverted yield curve
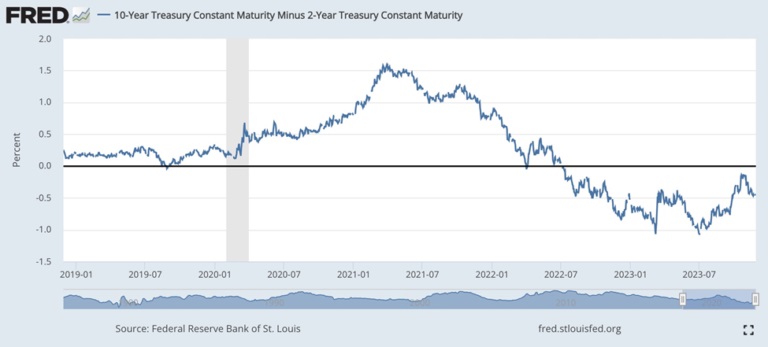
In a typical healthy market, the yield curve (typically the spread between the US 10-year Treasury note and the 2-year note) shows lower returns on short-term investments and higher yields on long-term investments. This makes sense, as investors earn more interest for tying up their money for longer. The yield curve is said to “invert” when short-term yields are higher than long-term yields.
The yield curve has inverted 28 times since 1900, and in 22 of those times, a recession followed. For the last six recessions, a recession began six to 36 months after the curve inverted. Typically a recession follows six to 12 months after the yield curve inverts.
According to the FRED chart below, the yield curve between the 2-year and the 10-year has been inverted since spring, 2022.
A CNBC article published in September states that some firms and so-called experts are now walking back their recession predictions based on yield curve inversion, and suggests why “this time may be different.”
“While it is true that the yield curve has predicted the past several recessions, in more recent experience it’s been sort of a broken odometer for the economy,” CNBC quotes Mervin Jebaraj, economic policy survey chair at the National Association for Business Economics.
The article goes on to say that the US would have already fallen into a recession if not for a strong job market, according to a NABE survey, which also found that two-thirds of economists surveyed were at least somewhat confident the Federal Reserve can help the US economy to a soft landing.
Meanwhile, a transcript from an NPR podcast titled ‘Planet Money’, with Darian Woods and Adrian Ma, mentions the economist who discovered the predictive powers of the yield curve inversion, Duke University economist Campbell Harvey.
Here’s where it gets interesting.
The podcast has Campbell, the inventor of the yield curve inversion theory, saying that “there are many reasons now why the model could be giving a false signal.”
One reason, matching what was said by the NABE, is that there are currently more jobs openings than unemployed: 1.7 jobs for every person out of work. It means that even if someone suddenly finds themselves laid off or fired, it is likely they will find another paid position within a relatively short period of time.
Campbell’s second reason for the predictor failing, is the fact that Americans now are less in debt than they were, say in 2008, when the yield curve inversion correctly predicted a recession. This could partly be due to the stimulus payments doled out during the pandemic, which prudent Americans used to pay down debt and/or add to savings.
Campbell’s third reason for the yield curve failing to predict a recession in 2023 is “because everybody knows to watch out for it now.” For instance, says podcaster Woods, “businesses that are watching the yield curve might be more cautious as a result, and they might not overinvest in things like new factories or hiring a bunch of people. So, when slower growth arrives, Campbell says they’re better able to withstand it. In other words, the yield curve might be so right that it becomes wrong.”
GS economists Praveen Korapaty and William Marshall wrote that, investors appear to be pricing in secular stagnation – an economy marked by low growth and low interest rates – and that real rates will revert to levels that presided before the global COVID-19 pandemic as the Federal Reserve begins to relax policy restriction.
They also noted that the US growth outlook continues to improve. Earlier this month, Goldman Sachs Research lowered its odds of a recession in the next 12 months from 35% to 25%, citing persistent strength in the labor market and early signs of improvement in business surveys. If the economy continues to prove resilient, investors will likely update their forecasts and build in expectations for higher long run rates, resulting in a more modest yield curve inversion.
Motley Fool points out that, as of January 2023, the New York Fed’s probability of a US recession within the next 12 months was 57.3%. The New York Fed’s tool is the difference in yields between the 10-year and three-month Treasury bonds.
Except for 1966, when the New York Fed’s recession probability was 41.4%, and no recession followed, every other instance where it surpassed 40%, for the past 56 years has led to a recession within 12 months.
Employment
We’ve already mentioned the rosy employment picture as an important reason for the US avoiding recession, despite several indicators pointing towards one.
Claudia Sahm is a former Federal Reserve economist and the creator of the Sahm rule, a recession indicator. In a Bloomberg column earlier this month, Sahm admits that her rule, which would have triggered early in every recession since 1970, has not triggered now.
The Sahm rule is fairly simple. It says if the three-month average of the unemployment rate is half a percentage point or more above its low in the prior 12 months, the economy is in a recession. The current value is 0.33, meaning we are not.
The article notes that after two years of severe labor shortages, workers are coming back at a faster pace than new jobs are created — once again confirming what the NABE and the NPR podcast said, i.e., that there are more workers than job openings.
“If that’s the case,” states Bloomberg, “recession indicators based on the unemployment rate, like the Sahm rule, may not be as accurate this time.”
Companies making money hand over fist are fueling the job market. Unemployment, a key Fed metric, is currently at 3.9%, nationally, lower than the long-term average of 5.7%.
We already know corporations borrowed low and channeled a lot of profits into money-market funds bearing high interest rates. That helped stocks immensely. Now we have a huge increase in reserves and liquidity.
And remember all that cash, estimated to be over $6 trillion, will be withdrawn from these money market funds, now earning 5%, when interest rates start to go down, which they already have.
ISM/ PMI
The ISM Manufacturing Index (ISM), also known as the Purchasing Managers Index (PMI), is a recession-forecasting tool that, according to Motley Fool, hasn’t been proven wrong in 70 years. The monthly index surveys more than 400 industrial sector executives. Their answers provide data for five components within the index: new orders, employment, production, supplier deliveries, and inventories.
Financial talking heads often reference the PMI as a measure of the economy’s health. A number above 50 typically represents economic expansion, anything below 50 is a contraction.
Here again is where it gets interesting.
“Between 1948 and 2023,” states Motley Fool, “the ISM Manufacturing New Orders Index fell below 43.5 on 14 occasions. Except for a steep decline in the early 1950s, a drop below 43.5 has signaled a US recession every single time for seven decades.”
“In January, the ISM Manufacturing New Orders Index fell to 42.5. Not counting the pandemic-induced recession in 2020, this is the lowest reading since the Great Recession.”

Fair enough. The ISM/ PMI was not looking good in January, however, fast forward 10 months, and we find the Manufacturing PMI registered 46.7, lower than the 49% recorded in September, but 4.2 percentage points better than the start of the year.
According to the Institute for Supply Management, the economy dropped back into contraction after one month of weak expansion, preceded by nine months of contraction and 30 months of expansion before that.
But wait. According to ISM, a Manufacturing PMI above 48.7%, over a long period of time, indicates an expansion of the economy. When plotted over the past year, as the table below shows, the average was 47.4, only 1.3 percentage points away from an expansion. While not robust economic growth, it’s far from “the lowest reading since the Great Recession” in January cited by Motley Fool.
Put another way, the economy was expanding for 30 months before the contraction started 12 months ago, and the latest reading, 46.7 in October, is only 1.3% below what the ISM considers an expansion over a long period of time. And we are nowhere near 43.5, the number that has signaled a US recession every single time for seven decades.
Source: ISM
Ahead of the Herd found evidence to suggest that a declining ISM is actually positive for a soft landing. This is counter-intuitive; lower economic activity should lead to job losses and low growth, all the bad elements of a recession.
But when you think about it, it’s logical.
The Fed is trying to slow the economy, and quell inflation, through interest rate hikes, which slow borrowing by individuals and corporation. As aggregate demand slows, supply chains gummed up by the pandemic aftermath have begun to smoothen out.
One of the results of a declining ISM is lower input costs. Consider the following from an article by S&P Global Market Intelligence:
Recent months have seen the most aggressive Fed tightening in modern history, and any lack of impact on the economy would run counter to expectations.
However, although inducing a downturn in business activity, more encouragingly Fed rate hikes also appear to be driving down inflationary pressures, as signaled by a further marked cooling in the rate of increase of firms’ costs in November.
The all-sector PMI input cost index sank to its lowest since December 2020, and had fallen continually since peak in May 2022. This PMI index acts as a reliable forward-indicator of consumer price inflation, and points to inflation falling markedly further.
The cooling of inflationary pressures in the PMI is being led by an especially marked slowing of input cost inflation in manufacturing, which is also clearly being likewise signalled in the official producer price data. However, service sector input cost inflation also cooled slightly in November…
While the reduced supply chain stress is partly a symptom of lower demand, the alleviation of supply delays removes a key driver of inflationary pressures and has helped moderate the overall rate of input cost inflation to a near two-year low. November even saw increasing numbers of suppliers, factories and service providers offering discounts to help boost flagging sales.
In this environment, inflationary pressures should continue to cool in the months ahead, potentially markedly.
Conclusion
Surprising though it sounds, the Fed is succeeding in its goal of using rate hikes to reduce inflation.
Indeed, if we didn’t see these manufacturing/ service input costs decrease, then the Fed would have to keep going with interest rate hikes until they saw inflationary relief.
My earlier-in-the-year prediction of a rate hike pause has turned out to be correct. Could the Fed raise interest rates again? It’s possible, but unlikely, given that its plan for reducing inflation is working. We can see it with our own eyes in the declining cost figures cited by S&P Global.
Eventually business cost reductions should trickle down to decreases in the prices of consumer goods, though there is always the temptation for firms to maintain their margins and keep prices elevated.
The Fed will need to keep a close eye on the price of money by controlling interest rates. But it’s a careful balance. The rate needs to be close to the “natural rate of interest”, which is the price of money that balances saving and investment while keeping inflation stable — in the US and Canada the inflation target is typically 2%.
The Fed is on pause. A wait and see approach – have they done enough to cool inflationary pressure, seems like, or do they need to raise, potentially twice more, to get inflation into their preferred goldilocks zone?
If, as so many believe, we are in a recession, or will be shortly, it’ll be so shallow and brief it will be over long over before it’s even recognized as a recession in the middle of 2024.
I expect most people to see exactly what they think they see, a hard landing and a recession, when looking at leading indicators for the economy. But as I’ve shown, things aren’t always so clear cut.
Let us review;
- LEI – could give false signals and predictions that may not always be accurate admits the Conference Board, which invented the LEI.
- Yield Curve – The National Association for Business Economics says ‘yield curve sort of a broken odometer for the economy.’ Duke University economist Campbell Harvey, the inventor of the yield curve inversion theory, says ‘there are many reasons now why the model could be giving a false signal.’
- Jobs – Claudia Sahm is the creator of the Sahm rule. In a Bloomberg column earlier this month, Sahm admits that her rule, which would have triggered early in every recession since 1970, has not triggered now. Bloomberg says ‘recession indicators based on the unemployment rate, like the Sahm rule, may not be as accurate this time.’
- ISM/ PMI – Is nowhere near 43.5, the number that has signaled a US recession every single time for seven decades. ISM/ PMI is 4.2 percentage points better than the start of the year.
The Federal Reserve has a plan, combat inflation with a series of rate hikes over a short period of time, pause, analyze. So far, their medication is working, the Fed dosed the economy with Buckley’s – tastes awful, but it works.
Richard (Rick) Mills
aheadoftheherd.com
subscribe to my free newsletter
********
More from Gold-Eagle


