Here’s The One Gold Chart To Watch


In recent weeks we’ve noted the positive developments in the gold stocks despite the sector being in a period of correction.
Last week we shared the idea that the next impulsive move in gold stocks might begin when the correction in the metals ends.
In this article, I’m going to share the one chart, which I think will help us time that next move higher.
In recent years I have repeatedly noted the importance of the gold against the S&P500 ratio chart. It is going to be challenging to see gold make a considerable move higher without it outperforming the stock market.
However, with the gold stocks now outperforming gold and not too far from a massive breakout in 2020, the most important chart is the gold stocks against the stock market.
Specifically, let’s look at GDX against the S&P500.
The gold stocks relative to the stock market put in what should become a historic double bottom in 2015 and 2018. These lows mark the points where gold stocks relative to the stock market were the cheapest in 90 years!
The gold stocks will be headed for that significant breakout when this ratio approaches that red resistance line and then rises above it.
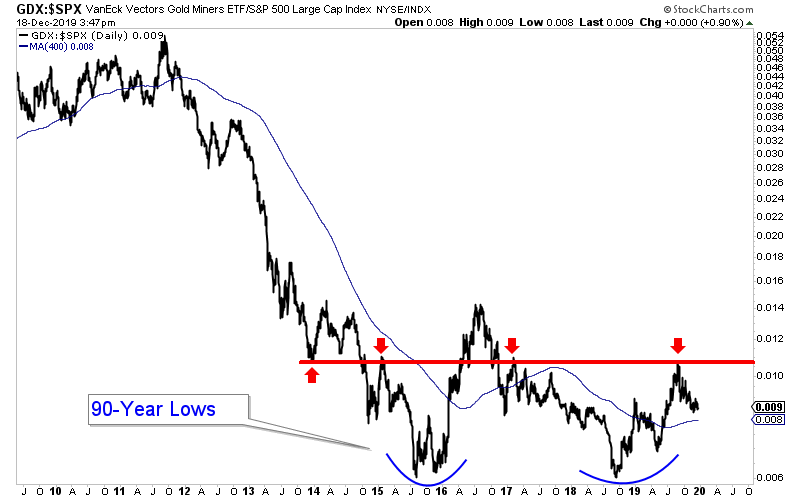
The gold stocks could perform well before the ratio breaks that resistance…but do not expect anything substantial until the break.
Concerning the position of the gold stocks, there are strong similarities between today and the 1960s.
As depicted below, gold stocks bottomed at the end of 1957 and performed well alongside a rising stock market.
However, the massive move in gold stocks began after 1963 when the Barron's Gold Mining Index to S&P500 ratio started its ascent and broke to a 10-year high in 1965.
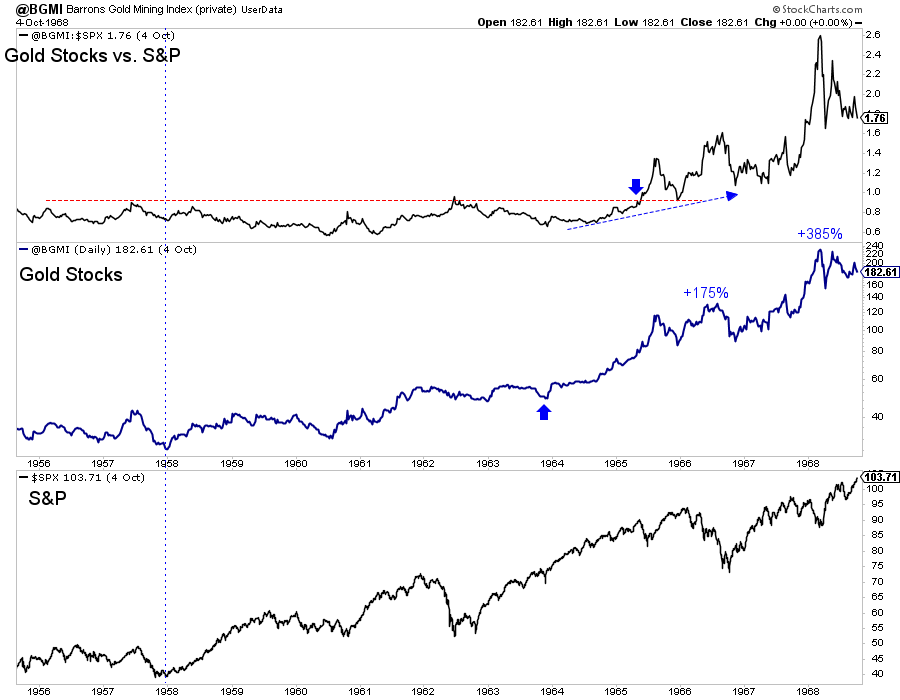
History does not always repeat itself perfectly, but the lesson here applies to the present.
In the 1960s, the gold stocks performed well alongside a rising stock market. They performed exceptionally well when they began to outperform the stock market strongly.
The potential massive breakout in GDX will be accompanied by the GDX to S&P500 ratio attacking and breaking above that line of resistance.
At present, the GDX to S&P500 ratio is correcting and may test its 200-day moving average.
As noted in my previous article, I would not be surprised if gold and silver tested their 200-day moving averages, which could pull the miners lower temporarily.
Get positioned soon by buying quality juniors on weakness.
We continue to focus on identifying and accumulation the juniors with significant upside potential in 2020. To learn the stocks we own and intent to buy that have 3x to 5x potential, consider learning more about our premium service.
********

Jordan Roy-Byrne, CMT is a Chartered Market Technician and member of the Market Technicians Association. He is the publisher and editor of TheDailyGold Premium, a publication which emphasizes market timing and stock selection, as well as TheDailyGold Global, an add-on service for subscribers which covers global capital markets. He is also the author of the 2015 book, The Coming Renewal of Gold’s Secular Bull Market which is available for free. TheDailyGold.com was recently named one of the top 50 Investment Blogs by DailyReckoning and WalletHub.


