Higher Gold Price Ahead


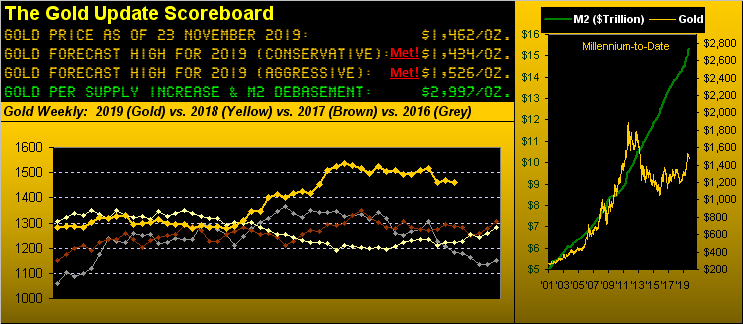
In looking from here into year's end, our best judgmental read is for higher Gold ahead. With Gold having settled out the week yesterday (Friday) at 1462, you may recall from a few missives back our having been asked at a Sunday Investors Roundtable as to "Where do you see Gold finishing the year?" ... Gold then at 1517 ... and that 'twould finish "Probably right about in here." And back up to that low 1500s area still makes sense to us with some five trading weeks for the balance of 2019.
Still, since that answer, Gold has traced what we in fact view as a favourable route in having worked its way lower to successfully test the 1454-1434 "support shelf", something we've sensed all along was technically "necessary" in price's search for a reasonable bottom within the overall ongoing weekly parabolic Short trend. We now regard that trend as having run the worst of its course and thus look to higher Gold ahead.
Indeed in turning to Gold's weekly bars from a year ago-to-date, price decline has now become price hesitation as you can clearly below see upon its having encountered the "support shelf". Moreover, this present parabolic Short trend is the fourth such downside stint since the start of 2018, the duration of the prior three respectively having been 11, 19 and 13 weeks in length. This current one already is 10 weeks in duration and its downside slope is slight in comparison to the upside steepness of the more dominant Long trends. We now therefore see Gold as rather trapped between the two forecast highs for this year as shown on the graphic ("conservative" at 1434 and "aggressive" at 1526) for the remainder of 2019, the trading bias being to buy, (barring boffing below the "support shelf" altogether). In other words, 'tis time for you shameful Shorties out there to cover yourselves and exit the premises, given higher Gold ahead:

Further, here's a little signaling nugget which also suggests higher Gold ahead. Without getting excessively esoteric, should you have access to a technical analysis platform, it may well include a "canned" study called "moneyflow". (In fact, this study is one of the intricate elements of the website's Market Rhythms page). Moneyflow combines volume with price movement -- so as to determine participatory "umph" or lack thereof -- and is charted on a scale from 0 (weakest) to 100 (strongest). Readings above 80 may be considered "overbought" and below 20 as "oversold". The current moneyflow reading for daily Gold is 26. That is an infrequent, low moneyflow reading for Gold such that if you look all the way from price's key bottom late in 2015, on those rare occasions such as now where the reading has been 26 or less, price has then found itself dozens of points higher over the ensuing weeks. (Notwithstanding the usual "past performance" disclaimer, please advise as to where we may send our invoice).
What hasn't been getting much honest voice is the Economic Barometer. Nary a day goes by without hearing "The economy's doing great!", and to be sure, we're told there are more jobs available than folks to fill 'em, so one can't complain about that. However, payrolls hardly encompass the entirety of the over 50 monthly metrics that shape the course of the Econ Baro. And yet, it has been on the up move of late: November's Philadelphia Fed Index doubled from 5 to 10 and the University of Michigan's Sentiment Survey improved, as did October's Housing Starts, Building Permits and Existing Home Sales. 'Course, the ongoing bee in our bonnet remains the amazing, non-earnings supported height of the S&P 500: for how much longer can one surf that giant wave before being violently sucked under water?
Let's face it folks: Q3 earnings season was mediocre by our measuring, which looks for improvement rather than beating estimates. From the website's finalized table, highlighted below in the purple box we see that just 52% of some 2,100 companies improved their bottom lines vis-à-vis their Q3 readings from a year ago...
...and yet year-to-date the S&P 500 nonetheless is +24%? Yikes!
"But there're no interest rates, mmb..."
Yep, same old saw there, Squire. Savings today is invested in risk, all within a world drowning under some $250,000,000,000,000 of debt. Given today's global population of 7,700,000,000 that works out to $32,468 per person on the planet to pony up. (We'll add that to the aforementioned invoice).
So no wonder whatsoever that our "live" price/earnings ratio for the S&P 500 is 36.8x, (Bob Shiller's CAPE at present is 30.2x). What happened to 15x being taught as "expensive"?
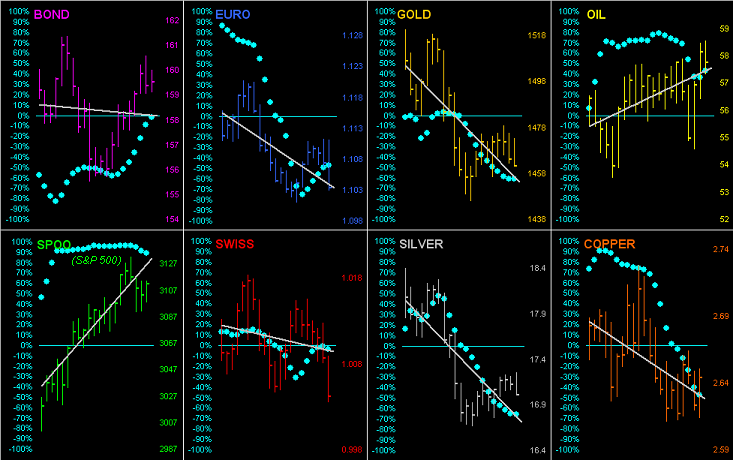
The good news near-term for Gold is that it has been trading in almost perfect negative correlation to the S&P as we next see per this chart of their respective percentage tracks from one month ago-to-date...
...and the reason that is good news is -- should such negative correlation continue -- the S&P looks poised to pullback, and with that, higher Gold ahead.
As to the S&P nearing said downturn, let's go 'round the horn for all eight BEGOS Markets components with their respective daily bars from a month ago-to-date, grey regression trendlines, and baby blue dots that depict each trend's consistency. Have a look at the lower-left panel in green: that is the S&P 500, wherein its "Baby Blues" are starting to lean lower; our rule of thumb is upon their breaking below the 80% level (left axis) that price shall continue southward ... and thus Gold northward, per their inverse correlation. Note further that only the S&P and Oil are in uptrends, but that in both cases their blue dots are unraveling: that in turn also ought soon play favourably for Silver, the Bond, and the EuroCurrencies (in spite of Friday's rightmost "Lagarde Bar", her introductory address as President of the European Central Bank not garnering currency confidence):
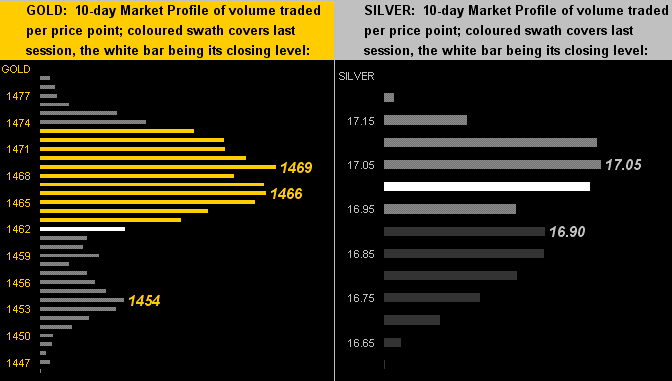
Therefore, confidence should return to the precious metals, especially as their prices climb back atop the overhead trading resistance as next shown here in the 10-day Market Profiles for Gold on the left and Silver on the right. That means getting Gold up over the hump into the 1470s and seeing Sister Silver reaching above her 17.10 area:
In closing, not that we give a derrière du rat, but whatever happened to bits**t? Have you been watching it? Seems it has been relegated below-board for subversive means that we're not supposed to see. Not quite a month ago on 28 October 'twas trading over 10,000; then through 07 November found it in the 9,000s; then into the start of this past week 'twas down into the 8,000s, only to fall further into the 7,000s ... and then yesterday it peeked down into the 6,000s, (before settling at 7,345). If one has such digital crytocrap in one's pants, we wonder: like a phone does it vibrate under duress? At least hard currency coins respond with a pleasant pocket jingle if under duress when running to catch the bus. Better yet, catch some of the yellow metal instead, for we see higher Gold ahead!
www.deMeadville.com
www.TheGoldUpdate.com
********

Mark Mead Baillie has had an extensive business career beginning in banking and financial services for two years with Banque Nationale de Paris to corporate research for three years at Barclays Bank and then for six years as an analyst and corporate lender with Société Générale.
For the last 22 years he has expanded his financial expertise by creating his own financial services company, de Meadville International, which comprehensively follows his BEGOS complex of markets (Bond/Euro/Gold/Oil/S&P) and the trading of the futures therein. He is recognized within the financial community of demonstrating creative technical skills that surpass industry standards toward making highly informed market assessments and his work is featured in Merrill Lynch Wealth Management client presentations. He has adapted such skills into becoming the popular author each week of the prolific “The Gold Update” and is known in the financial website community as “mmb” and “deMeadville”.
Mr. Baillie holds a BS in Business from the University of Southern California and an MBA in Finance from Golden Gate University.


