How High Can Gold Go Before Peaking Gold Dow Jones Ratio Important Indicator
How about $10,000? or $1,000? Or even $100,000?
Calls for the price of gold vary, anywhere from $1,000 to $10,000 or even to $100,000. There is one true fundamental problem with all calls for the price of gold - they all ignore the future inflation environment.
For example, if a genuine Great-Depression-like deflation grips the U.S. economy, then $1,500 for the top of the gold bull market might be too high. On the other hand, if a long 1970 stagflation is in the cards, then $5,000 is too low. The point is that a call for the price of gold without a clear assumption for the macroeconomic environment is a wild and misleading shot in the dark.
Curiously, once gold shot up to $850, gold analysts did not waste time to update higher their long-term projections for the price of gold. My feeling based on a dozen authors is that the new consensus range for the top is in the $2,000-3,000. I beg to disagree. Their math is simple, but poor. Let me explain.
They say that gold peaked at $850 in 1980; I agree. They say that CPI is up about three times or money supply is up about four times since then; I also agree. It then follows that gold has the potential to peak in the 2,000-3,000 range; now I disagree . Here is one simple reason. We might say that this range is fair if this were the price of gold today . However, it might take four to five years to get there. The trick is that in these four or five years, price inflation and money supply may rise by another 50-100%, so by then the target moves higher, say to the $4,000-5,000 range. Then you need another 2-3-4 years to reach the target. The problem is that the target is moving; it moves approximately with the rate of inflation.
The advantage of the above approach is its simplicity and intuitiveness. However, it has obvious disadvantages. First, the target is a moving variable with unknown speed. Second, it ignores the macroeconomic environment. Clearly, deflation, stagflation, or strong inflation in coming years will make a world of difference for the target price of gold. Finally, it ignores basic market sentiment indicators like fear and greed.
Actually, a radically different approach provides a much better and much simpler answer. It also avoids the pitfalls of the previous approach. Most importantly, it tells us when the bull market is over. Thus, it tells us when to sell. It is based on the fundamental premise that in the long run, there must be a balance between the relative prices of financial assets and real assets. Roughly speaking, stocks and bonds are examples of financial assets, while commodities and real estate are real assets.
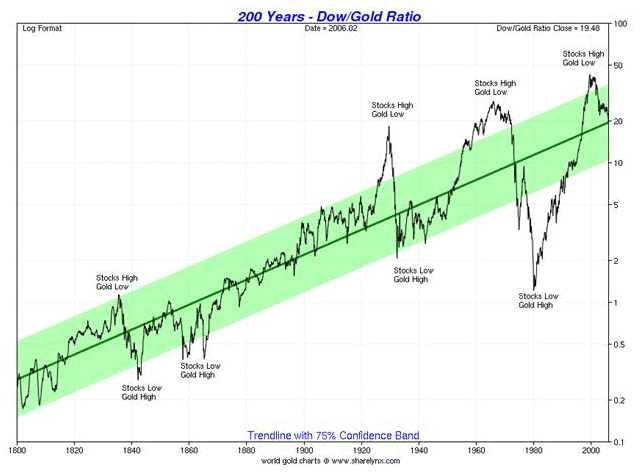
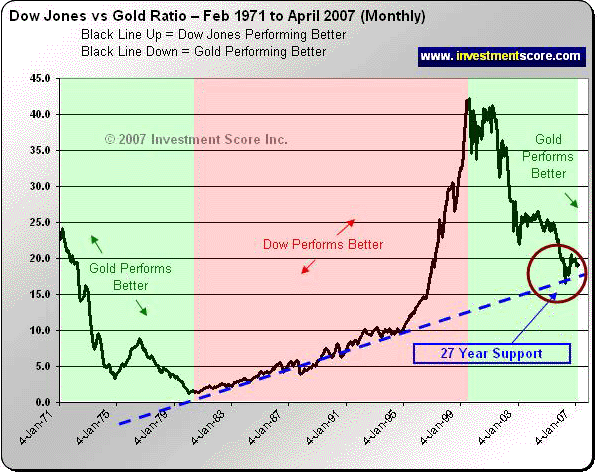
During the decades, the relative prices of real and financial assets swing wildly away from their well-established century-old mean. They inevitably revert to it, and then swing to the opposite extreme. A well-established proxy for the price of financial assets is the Dow Jones Index. The single best proxy for commodities is gold. Their price ratio, the Dow-Gold ratio, tells us how many ounces of gold buy one unit of Dow Jones. If today the Dow is 13,600 and gold is $800, the gold-Dow ratio is 17. Thus, it takes today 17 ounces of gold to buy one unit of the Dow Index.
History tells us is that secular bull markets for stocks can push this ratio high up in the range of 20-50. Look at the chart below. During the last century, there were three such secular (long-term) peaks, in 1932, 1966, and 2000. You can see the three peaks in the 20-50 range.
On the other hand, secular stock bear markets usually coincide with secular gold bull markets. At the secular peak for gold, the Gold-Dow ratio is in the range of 1-2. As you can see on the chart, 1900 recorded a low of 1.7; 1929 recorded a low of two; 1980 recorded a low of about one. This means that when the gold bull market peaks, the price of gold will roughly equal the Dow Jones Index (DJI). Thus, we should expect that gold outperform the DJI in the coming 10-15 years about 10-20 times, in order to bring that Dow-Gold Ratio down to the range of 1-2.

So, how high will gold go? The correct answer is simple: as high as Dow Jones. It is important to understand that this method does not tell us now the end of the bull market. It could be five, ten, or fifteen years from now. It also does not tell us how high. It could be $2,000, or $10,000, or $50,000. But the important point is that it tells us when we are there and inherently keeps track of the macroeconomic environment.
Which is the most likely price target will depend on how Fed will fight inflation. Based on the Fed's reaction, there are three possible future scenarios: (1) deflation, (2) stagflation, and (3) strong inflation. Let us consider each in turn.
The first scenario , deflation, implies a major contraction in the supply of money and credit, similar to the one during the Great Depression. Consumer and commodity prices would fall rapidly; the stock market and real estate market would collapse. Back then, stock prices and real estate fell roughly 10 times and gold rose only a little. If this scenario were to play out, then a reasonable forecast for the Dow will be about $1,000-1,500, while the gold price will be likely in the range of $800-1,500. This scenario is highly unlikely as the Fed will fight tooth and nail to prevent a deflation from taking hold.
The second scenario , stagflation, is most likely. It should look similar to the 1970s. Back then, the Dow made its peak in 1966. It made little progress for about 15 years, so that in 1980 it was just about where it was in 1966, roughly around 1,000. Gold, on the other hand, rose from a low of $35 all the way to $850. This means that strong inflation during the period kept the Dow from falling, so it did not fall as it did during the Great Depression. On the other hand, inflation powered the price of gold about 25-fold. In this scenario, we should expect the Dow to remain range-bound in the 10,000-15,000 range. Then, a gold forecast of 10,000 is perfectly realistic.
The third scenario , very strong inflation, is definitely possible, although less likely than stagflation. This would mean a typical, commonly-observed inflation of a third-world country, may be 15-25% annually. This kind of inflation could easily power the Dow may be 3-4 times in the coming decade, may be all the way to $30,000-50,000. This could mean a $20 for a loaf of bread or a gallon of gasoline. This would imply a gold price in the range of 20,000-50,000. It is possible, even probable, but in my opinion, not very realistic.
To summarize, I believe that both deflation and very strong inflation are not very likely. The likely outcome will be stagflation. Then a $10,000 price of gold is consistent with this view. This is my price target for 2015-2020. My advice is simple - stay with gold and you will be fine in the long run.

21 February 2008
Krassimir Petrov ( [email protected] ) has received his Ph. D. in economics from the Ohio State University; and currently teaches Macroeconomics, International Finance, and Econometrics at the American University in Bulgaria. He is looking for a career in Dubai or the U. A. E.


