How To Know If We Are Heading For A Depression - Final Installment


Just to remind you, a few weeks ago, I wrote an article which outlined the potential for a major bear market lasting between 13 and 21 years. In fact, this may even cause a long-term depression. And, there were many comments to that article which mostly took objection to my view, which I categorized under the following 6 sections.
1 - "You need to take a more balanced approach incorporating fundamental analysis such as corporate earnings and economic data".
2- "Big banks are swimming in cash".
3- "The Fed will provide liquidity to keep us out of trouble".
4- "We do not have the same conditions as 1929".
5 - Outright disbelief in the potential for a long-term bear market.
6- How does one approach investing during a long-term bear market?
The first four sections have been addressed in the articles I published over the last two weeks.
Sentiment Speaks: How To Know If We Are Heading For A Depression - Part 1
Sentiment Speaks: How To Know If We Are Heading For A Depression - Part 2
This week, I will address sections 5 and 6.
Since we are dealing with financial markets, which are non-linear and uncertain environments, I want to make it clear upfront that a depression is obviously not a foregone conclusion. Therefore, I will end this series of articles outlining what I will need to see over the coming two years to tell me whether we are indeed heading into a 13-21 year bear market. And, if the market takes the path I lay out over the coming two years, then it will make a long-term bear market a high probability. Until such time, I am going to be taking my cues from the market action week by week and month by month, and will not likely take on an extreme bearish posture until I see strong confirmation in the next year or two. But, I will likely be raising a lot of cash in the coming months.
5 - Outright disbelief in the potential for a long-term bear market
With the market rallying strongly off the 4100SPX region struck this past October, we have seen a virtual straight lineup during this rally. And, it has converted many to not only a bullish view of the market, but with some even taking an extraordinarily bullish view of the market. In fact, the market action for the last decade reinforces the Pavlovian manner in which investors now believe that the market will "always comes back." I think the following comment I read likely summarizes most people's thinking about the market:
"Ultimately, crash or no crash, an 8% S&P return is something you can set your watch to for hundreds of years, including dozens of crashes. If it's down 50% one year, it's not the end of the world, it'll eventually just come ripping back in recovery. There's merit to look at a severe bear case for your investment outlook, I just wouldn't live inside that negativity."
It is also quite likely that many of you maintain the same perspective of the market. I mean, why would you not? If you look at the last 100 years in the market from a linear perspective, that really is the logical conclusion. However, the market is not a linear environment.
You see, these last 100 years have been what we Elliotticians view as a 3rd wave. And, it is quite a large degree 3rd wave at that, as it began in 1932. However, once a 3rd wave completes, it leads to a 4th wave.
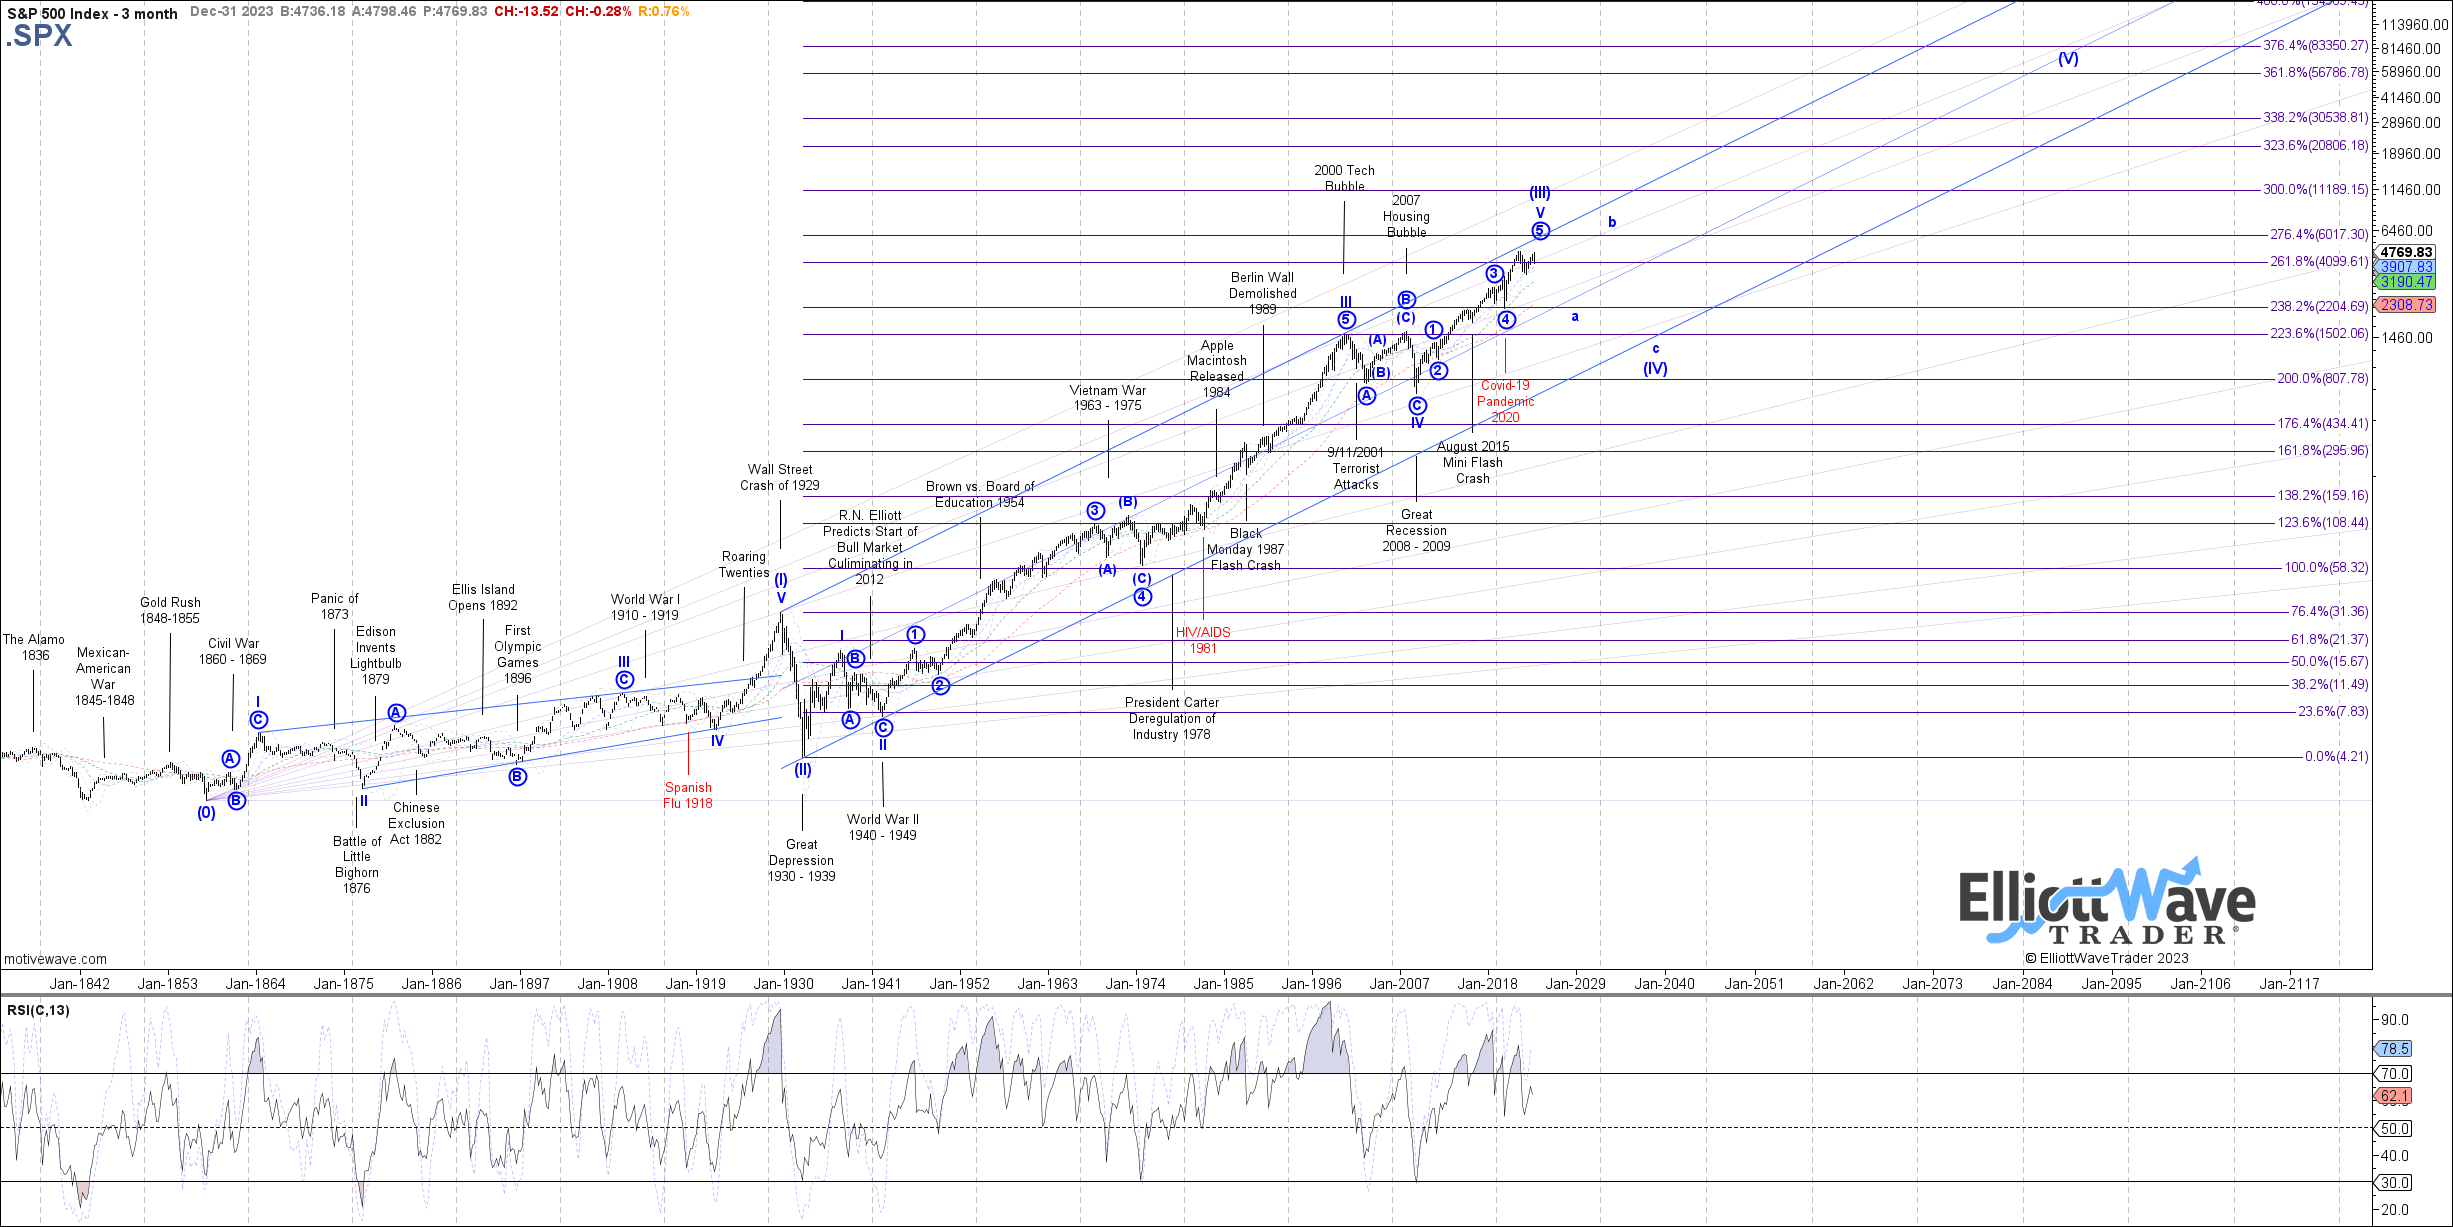
Elliottwavetrader.net
Let's look at the last 100 years in the SPX in a chart created by Garrett Patten at Elliottwavetrader. As you can see, not only are we likely in the final stages of a 5-wave structure off the 1932 wave [II] low, we are also completing a 5-wave structure off the March 2009 low. And, as you can also see from this chart, the 2000-2009 sideways action was the largest consolidation we have seen since we began this rally back in 1932.
Please note that the 2000-2009 correction was a wave iv within this wave [III] rally. Therefore, it is of one lesser degree than the wave [IV] we expect to begin in the not too distant future. And, since the impending wave [IV] is of one larger degree, the reasonable expectation is that it should take longer than a 4th wave of a smaller degree. For this reason, I believe that the impending wave [IV] bear market will likely last at least 13 years.
Yet, the market has trained all participants, in Pavlovian fashion, to expect what the commenter noted above: an 8% S&P return. While it may be true over the coming 50+ years, many investors may not have the ability to wait out the next 20+ years before the market begins to provide us with those returns again. That means there is potential for a bear market to last a full generation.
What I find even more interesting of late is that the current bullish action since October of 2023 has not only turned many former bears bullish, but it is now resulting in some outlandish market predictions across the spectrum. This past week, Bank of America pronounced they foresee a secular bull market that could last through 2033. I even saw one article this past week suggesting how investors should be positioned on the long side for the next 40 years.
What I also believe to be telling is the steady decline in interest for hedge funds. "Hedge funds are dead as a doornail," said Michael Sonnenfeldt, founder of ultra-high-net worth investing club Tiger 21. "Hedge funds have had a secular decline over the last decade because our members who wanted that exposure found that they could get it cheaper and better, less fees with the indexes or go direct with private equity."
Consider how sentiment works. More and more people believe that they can do better on their own simply because of the same perspective expressed in the comment I cited above. This type of hubris is really a result of bullish sentiment. I think this only adds to a reasonable expectation of a major top approaching. Of course, this is anecdotal, but it certainly supports the premise outlined in our long-term analysis view of the stock market.
I want to again note that I am not writing this article from the perspective of a perma-bear. I am the same person who suggested investors go long in early 2016 at 1800SPX with expectations that we will rally to 2600+ "no matter who wins the election." I am the same person who suggested investors go long at 2200SPX with expectations at the time that we will exceed 4000SPX. I am also the same person who viewed the 3500SPX region as a bottom in October of 2022, with expectations of a rally to at least the 4300-4500SPX region (with potential to get to 5000+). I am far from a perma-bear. My goal is to view the market as objectively as humanly possible.
But, in viewing the market objectively, I am seeing the strong potential of not only completing a 5-wave structure off the March 2022 low, and a larger 5-wave structure off the 2020 low, and an even larger 5-wave structure off the March 2009 low, but actually completing a very long term 5-wave structure off the 1932 low. And, when a 5-wave structure completes, we see the market turn in the opposite direction. Since we are completing a very long-term 5-wave structure, it is reasonable to expect a very long-term correction to take hold thereafter.
So, of course, it brings us to our next question:
6- How does one approach investing during a long-term bear market?
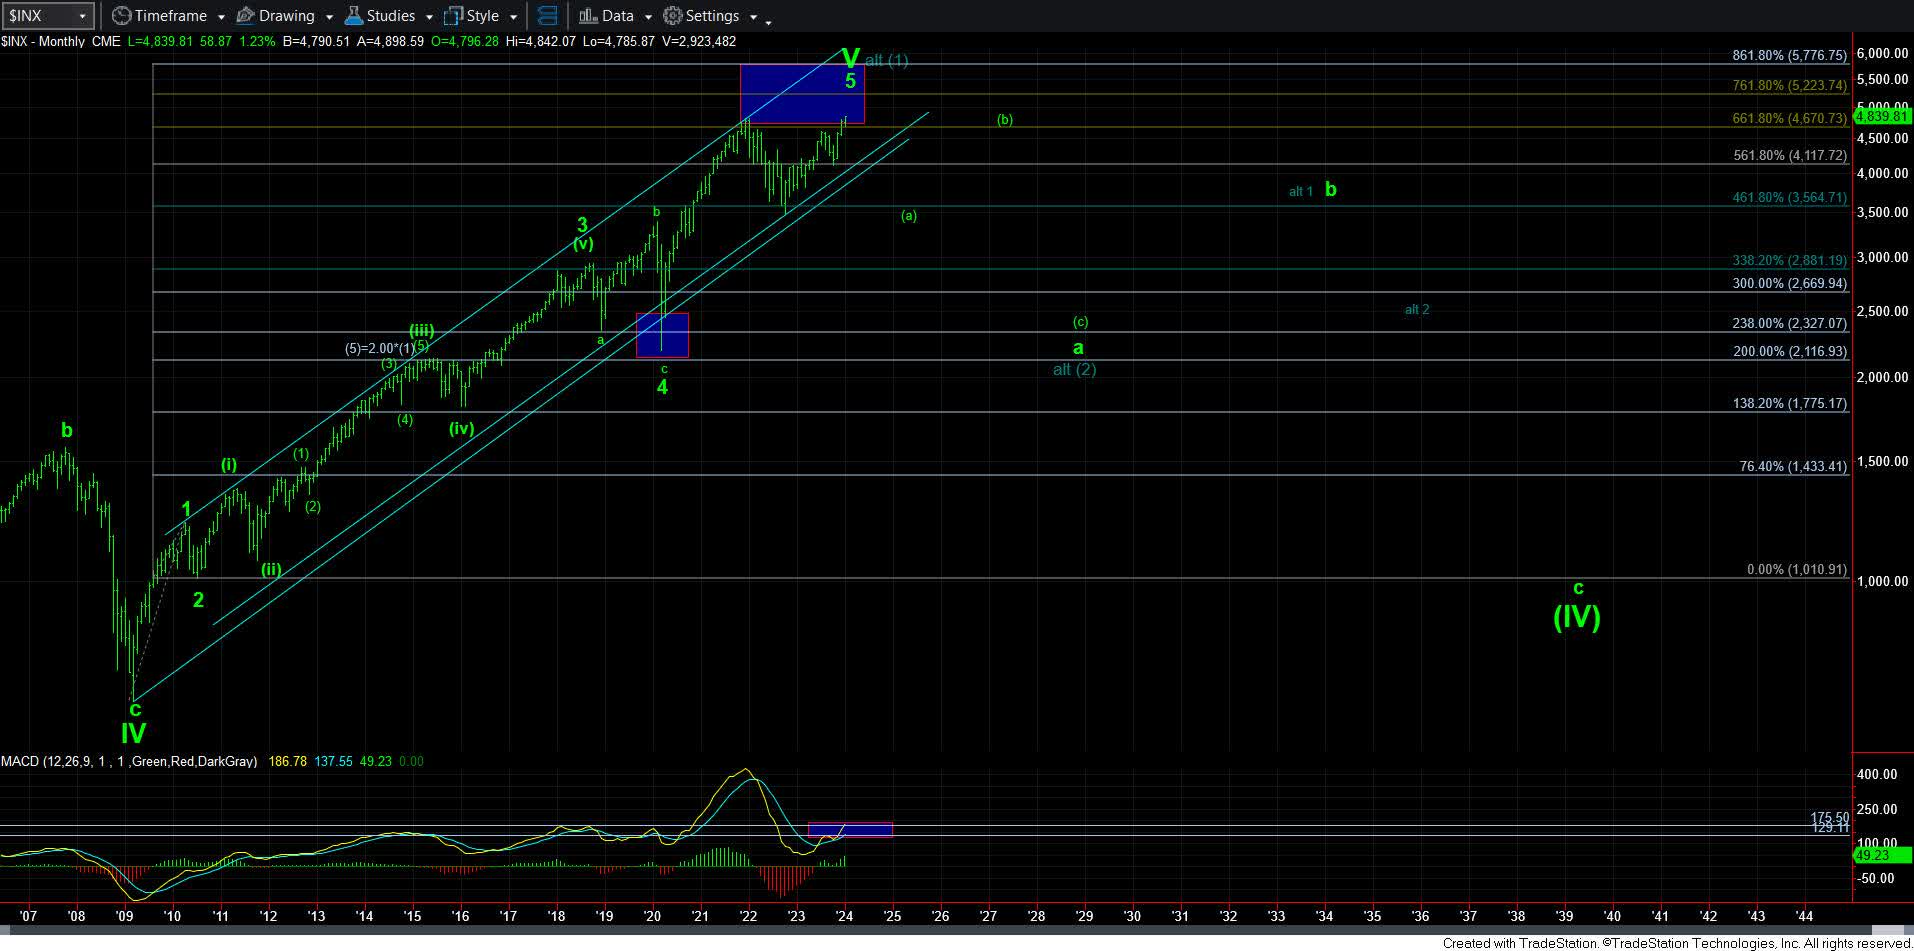
Allow me to show you a more zoomed-in perspective on a monthly chart of the SPX.
Elliottwavetrader.net
As you can see, we are now moving into a major topping box, which has been on my chart for many years. But, simply because we are now approaching what I view as a major market top potential does not necessarily provide me with confirmation that a major market top is being struck. So, allow me to outline what I am looking for in market action in the coming year or two to confirm a long-term bear market has likely begun.
First, I want to note that the rally off the October 2022 low seems to be taking shape as something we call an "ending diagonal." What we know of ending diagonals is that once they complete, they strongly reverse back to the region from which they began. In our case, it would mean a strong reversal back down to the 3500-3800SPX region. Should we see that in the coming year or so, that would be our first step in the confirmation process.
Thereafter, if the market should rally off that support in a very corrective and overlapping manner back to the 4600-4800SPX region, that would be the second point of confirmation for me. This would lead me to the expectation that a crash will likely develop after that rally to 4600-4800SPX completes, which would likely be the first of several crashes of differing degrees I would expect over the coming long-term bear market.
As I mentioned in a prior article, Elliott outlined something he referred to as the "Theory of Alternation." In basic terms, it suggested that 2nd wave and 4th wave corrections alternate in their size, shape and length. Since the relative wave [II] was a sharp crash-like decline which was relatively short as it lasted from 1929-1932, I would expect this wave [IV] to be a much more protracted and tortuous structure. So, as you can see on my monthly chart, I am expecting a number of multi-year declines and rallies as we move through this long-term bear market.
Now, I know the hallmark of many investors' plans focus upon dividend investing. That is because we have been enjoying a multi-decade bull market for the most part since 1932. However, should we move into a long-term bear market as I expect, it will likely result in economic conditions during which many companies will be forced to cut dividends, with some even ceasing their payments entirely in order to simply survive. We have been even seeing it begin recently and we have yet to even turn into the bear market just yet. And, in fact, many companies may not even survive. So, as a dividend investor, not only will your income potentially be cut, but so will your underlying capital investment.
As for me personally, I will likely be approaching the market in phases. Should the market provide me with the bear market confirmation as I outlined above, I will likely be raising a significant amount of cash (likely over 70% - depending upon the positioning of the various charts we track throughout the market) before we begin the decline I would expect in the [c] wave of the a-wave on the monthly chart. Since [c] waves usually take shape as a 5-wave structure and are considered to be crash waves, I would re-invest my cash holdings as we are approaching the conclusion of that 5-wave [c] wave.
Just to give you a bit of historical perspective, both the Covid Crash and the 2008 Financial Crisis were [c] waves of a larger degree. And, both provided recognizable investing opportunities as those [c] waves were completing. In fact, for those following my public analysis, you may remember my urging investors to move back into the market as the SPX was approaching the 2200SPX region, with an expectation that we rally from there to 4000+.
Should the market then rally in a multi-year corrective structure, I would likely then again raise cash as we approach the conclusion of the b-wave on the monthly chart, in preparation for what would likely be the largest crash seen in modern history in the c-wave of the larger degree wave [IV]. And, when that crash completes its 5-wave structure to the downside, that will likely be a generational investing opportunity for investors, quite similar to the opportunity seen at the lows in 1932, but not quite to the same degree of upside expectation.
So, while many do not like to hold cash, I will personally view it as a necessity as its relative value will rise significantly during those downturns in the markets and provide you with tremendous relative buying power at the various lows. But, I must warn you. Similar to prior troubled economic times, a significant number of banks will not likely survive. We have outlined many of the issues we see in the larger banks in these public articles:
https://www.saferbankingresearch.com/articles
Therefore, I strongly urge you to seek out the safest banks you can find to store your hard-earned cash. And, I also strongly urge you to do your own due diligence regarding the banks in which you currently store your cash. We have outlined our due diligence process here for those interested in replicating it:
https://www.saferbankingresearch.com/methodology-banks
Moreover, for those that believe you may be able to “hide-out” in bonds or precious metals, the current manner in which those charts are setting up seem to suggest that the precious metals will also enter into a bear market at the same time, whereas the bond market may be setting up to crash along-side the equity market.
Again, I want to reiterate that I do not believe markets are linear environments. Therefore, I believe one should utilize a non-linear analysis methodology in order to form objective and reasonable future expectations, which has served me quite well for decades on both the upside and downside shifts in the market during that time. It had me out of the market before the 2008 financial crisis, as well as out of the market before the Covid Crash. I plan on approaching the market in the same manner in the coming decade, of course, only after I receive the confirmation I noted above that a long-term bear market is likely taking shape.
“By failing to prepare, you are preparing to fail.” – Benjamin Franklin
********
 Avi Gilburt is a widely followed Elliott Wave technical analyst and author of ElliottWaveTrader.net, a live Trading Room featuring his intraday market analysis (including emini S&P500, metals, oil, USD & VXX), interactive member-analyst forum, and detailed library of Elliott Wave education. You can contact Avi at: [email protected].
More from Gold-Eagle


