How Much Will The DOW Index Correct In The Developing 2015-2016 Bear Market?


 All markets are cyclic…Bull Markets eventually end and Bear Markets ultimately end, regardless of asset class. It is Wall Street gospel that cycles are immutable…only duration and magnitude vary.
Since March 2009 we have witnessed one of the biggest bull markets in history. The DOW soared +178% from a March 2009 low of 6500 to its intra-day high of 18100 on December 31, 2014. This amazing bull feat was mostly accomplished via Washington’s “magic elixir” called Quantitative Easing. In essence QE is basically printing up money with wild abandon and spending it like a drunken sailor on leave from his ship. Since early 2006 the Washington Administration has printed $3.8 trillion (i.e. 3,800,000,000,000 dollars)…while keeping interest rates at near zero percent. To be sure much of this pumped up liquidity was sucked into Wall Street.
To really appreciate how exaggerated the Stocks’ Return has been since early 2006, one needs to put it into perspective…e.g. compare it to a reference point if you will. Stock Market Statistics show that the average yearly return of the DOW Index since 1929 (appreciation plus cash dividends) was 8.8% (4.6% plus 4.2% respectively). However, the yearly performance of the DOW Index since 2009 to date is an astounding 22.7% (18.5% plus 4.2% dividends). Difficult to believe…but true that the yearly DOW Index performance since 2006 is nearly THREE TIMES the average since 1929! Truly a Utopian pie-in-the-sky return.
(Source: http://observationsandnotes.blogspot.com/2009/03/average-annual-stock-market-return.html )
BUT UTOPIA NEVER LASTS…before ugly reality brings investors to their senses. Consequently, prudent investors not mesmerized by blind greed will eventually and methodically take exorbitant profits. Then the deluge begins when Joe 6-Pack panics and begins dumping his shares.
Irrefutable Signs That A Bear Market In Stocks Is On The Horizon
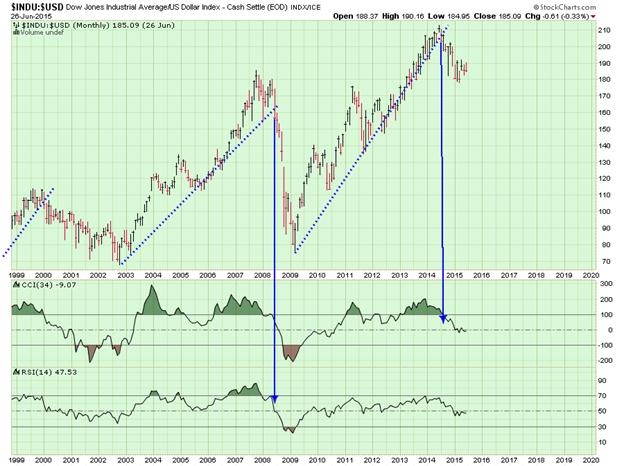
There are a couple of Technical Indicators that clearly herald a topping in Wall Street stocks (i.e. DOW Index). One is the DOW/US$ Ratio and the other is the US Treasuries/DOW Ratio.
The DOW/US$ Ratio and US Treasuries/DOW Ratio simultaneously forecasted the Bear Markets of 2000-2002 and 2007-2008, when the DOW Index fell -35% in 33 months (2000-2002) and plummeted -54% in 25 months (2007-2008).
Well again recently both Technical Indicators are giving SELL SIGNALS FOR STOCKS.
DOW/US$ Ratio Chart –
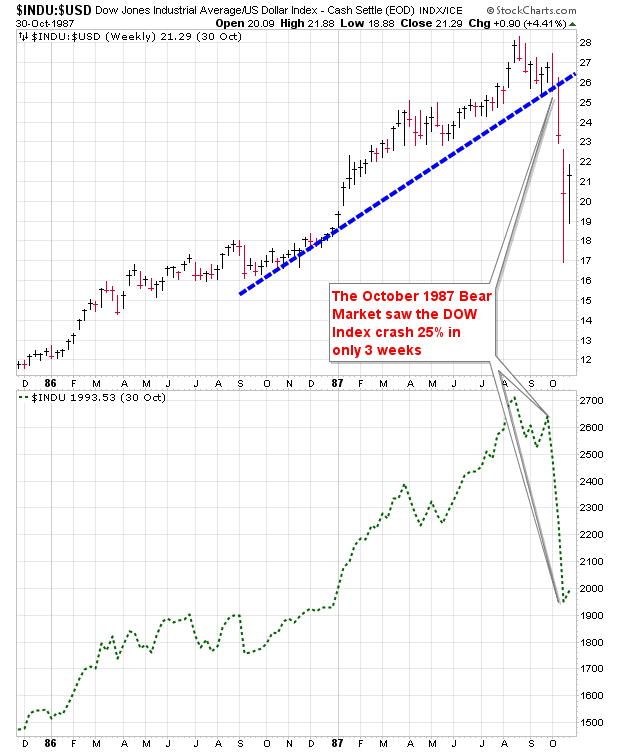
The same thing happened in October 1987 (as the DOW/US$ Ratio broke below its 13-month uptrend), when the DOW Index crashed 25% in only three weeks:
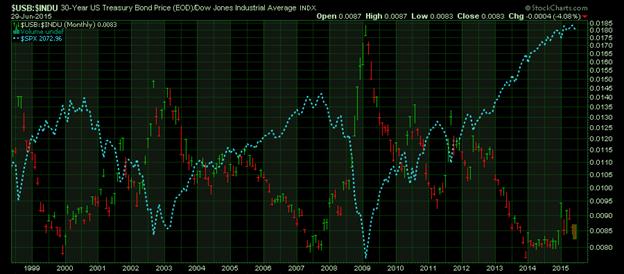
US Treasuries/DOW Ratio –
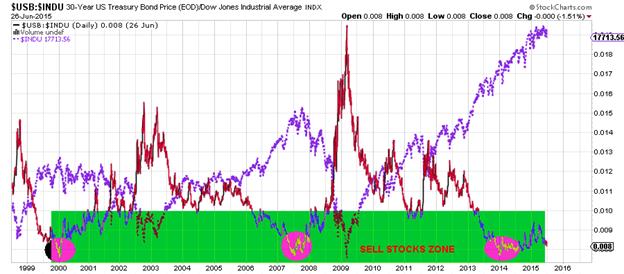
T-Bond/DOW Ratio
A time proven axiom in Wall Street is to dump stock and buy US Treasuries when stocks are way over-valued relative to perennial safe haven T-Bonds. The chart below proves the wisdom of this prudent investor axiom. Note that in early 2000 and again late 2007, the T-Bond/DOW Ratio was in the basement…thus heralding a forthcoming crash in Wall Street stocks. Indeed, two horrific bear markets ensued. In the first bear market (2000-2003) the DOW Index crashed -38% in 33 months. However, in the second bear market (2007—2009) the DOW Index was hammered down -54% in only 18 months.
It is vitally imperative to notice that the T-Bond/DOW Ratio is again bottoming in the basement. Without any suggesting BIG BEAR MARKET looms on the horizon…and it will most probably begin in 2015.
http://stockcharts.com/h-sc/ui?s=$USB:$INDU&p=M&yr=17&mn=0&dy=0&id=p60684220150
A Pow-Wow of Stock Bears is Gathering
A global pow-wow of prominent stock bears is gathering on the horizon. It is only a matter of time before the stock market plunges by 50% or more, according to several stock market pundits.
- “We have no right to be surprised by a severe and imminent stock market crash,” explains Mark Spitznagel, a hedge fund manager who is notorious for his hugely profitable billion-dollar bet on the 2008 crisis. “In fact, we must absolutely expect it."
- And globally known March Faber observes: “We are in a gigantic financial asset bubble,” warns Swiss adviser and fund manager Marc Faber. “It could burst any day.”
- Multi-Billion-dollar investor Warren Buffett is rumored to be preparing for a crash as well. The “Warren Buffett Indicator,” also known as the “Total Market Cap to GDP Ratio,” is breaching sell-alert status and a collapse may happen at any moment.
- MoneyNews opines - “Warning: Stocks Will Collapse by 50%”
......
The S&P500 is presently experiencing for the third time in the last hundred years, the highest returns for a 6-yearperiod. Since 1907 this only occurred twice before: in 1929 and 1999. These extraordinary phenomenal returns have been fueled not by fundamentals but rather by the U.S. Federal Reserve, which has been (and is now) trying to jumpstart the economy.
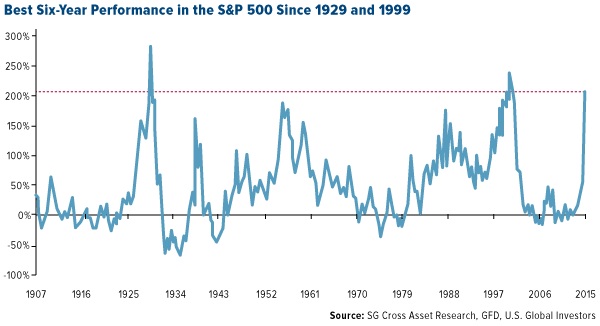
And history is testament that these periods of irrational exuberance and artificially generated levitations were almost immediately followed by CRASHING STOCK MARKETS. In the 1929-1932 Bear Market stocks crashed 89%...as measured by the DOW Index. During the 2007-2008 Bear Market stocks crashed 54%...as measured by the S&P500 Index.
Internationally known market analyst Michael Pento comments on “Exactly How Overvalued Is This Market?”
“First, the median Price to Earnings (PE) multiple on New York Stock Exchange (NYSE) equities is currently off the charts. Using this measure, the 2,800 NYSE stocks are at the highest level since records began since 1945.
Adding to this, the cyclically adjusted PE ratio (CAPE) for the S&P500, which uses real per-share earnings over a 10-year period, is at a current level of 27.17. This is far higher than the long-term average of 16.61, and only slightly below the 32.56 level achieved at the start of the Great Depression in 1929.“
Despite all the irrational exuberance from Wall Street pundits, the stock market is indeed sorely overvalued. Stocks are extremely expensive when compared to their 10-year average. Historically, stocks have a price-to-earnings ratio of 15; today, that P/E is 26.51. This means stocks are priced 76% higher than their 10-year average…which implies stocks are today hell bent for leather to suffer a material correction…if indeed not CRASH!
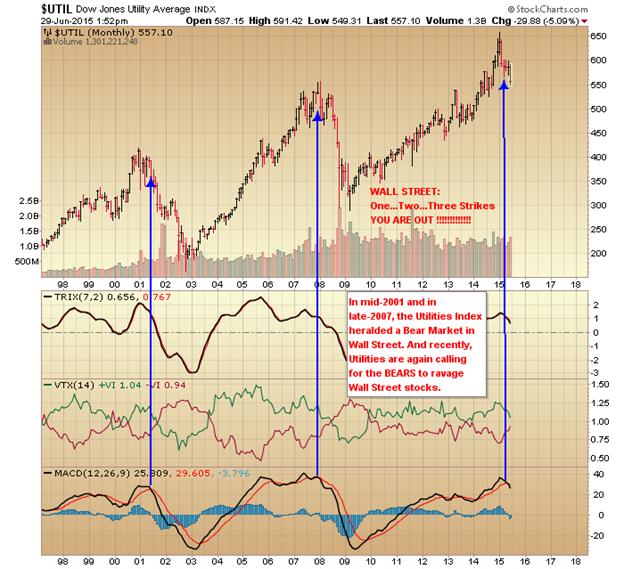
…alert…Alert…ALERT to all stock investors as today the Six-Year Performance of the S&P500 is again at the 1929 and 1999 danger levels. Moreover, the Utilities Index has often acted as a barometer (i.e. leading indicator) for stock prices. Indeed and fact the Utilities Index sounded the death knell for Wall Street in 2001 and late-2008 just before stocks plummeted. Furthermore, the Utilities Index has recently again trumped the death knell for the stock market. To prudent investors: LOOK OUT BELOW! See chart.
http://stockcharts.com/h-sc/ui?s=$UTIL&p=M&yr=18&mn=4&dy=0&id=p83909212523&a=407457831&listNum=2

 Bear Market Forecast For the DOW Stock Index
The average decline of the DOW Index in the two aforementioned Bear Markets was -44% with an average duration of 25 months. Therefore, if we assume the looming Bear Market might replicate an average drop in US stock values, the DOW Index could plummet to about 10100 by the Ides of March 2017.
Folksinger Kenny Rogers was prophetic in the lyrics of his world famous song: “THE GAMBLER” – as he ironically may have been referring to Wall Street speculators:
You've got to know when to hold 'em
Know when to fold 'em
Know when to walk away
Know when to run
You never count your money
When you're sittin' at the table
There'll be time enough for countin'
When the dealin's done
Every gambler knows
That the secret to survivin'
Is knowin' what to throw away
And knowin' what to keep
'Cause every hand's a winner
And every hand's a loser
And the best that you can hope for
Is to die in your sleep"
Since early 2009 the Bears have been in hibernation…but inevitably they leave their lair to ravage stocks.
********
Related Research
The US Dollar Rally Will Crush Stocks Just As It Did in 2008
History Of US Bear Markets…And 2015 Stocks Forecast
All-time record high NYSE margin debt sparks 1929-1932 bear market in stocks
Regression to Trend: A Perspective on Long-Term Market Performance
The Most Equitable Measure Of Stock Market Valuation Is Market Cap/GDP
A Derivatives Bomb Exploded Within The Last Two Weeks


