HUI - Correction Over!
- Gold/HUI ratio chart flashes 'BUY' for HUI
- Relative HUI chart flashes 'BUY'
- HUI approaching very strong support
The HUI faced a severe sell-off last week and is trading now as if gold were trading at $700 levels. Such huge anomalies never persist for a long period of time so what gives, or we should see a sharp decline in the gold price or the HUI will catch up sharply from here. We've been through all this many times before. A good example concerns December last year. The HUI was trading at levels as if gold were trading at $650. The HUI was a screaming 'BUY' at that time and rocketed all the way up from 360 towards its recent high (March) of 500+. (See also my piece “HUI – Correction over, December 17, 2007” )
As said above such anomalies never persist for a long period of time. The Gold/HUI ratio chart is an excellent indicator for such anomalies and flashes a 'BUY' again these days. Let's take a peek at the Gold/HUI ratio chart first:
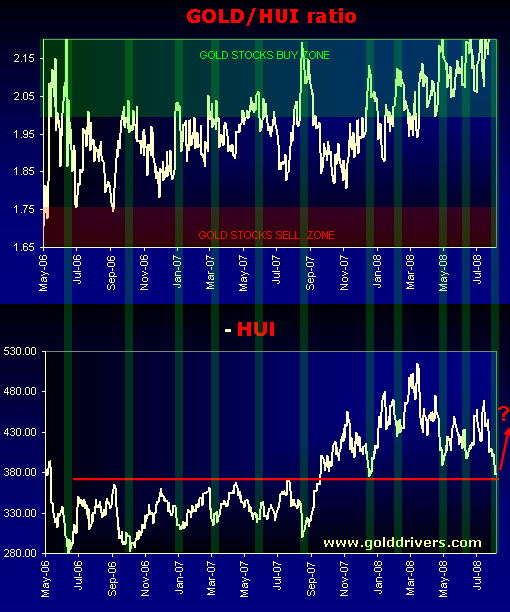
The Gold/HUI ratio chart flashes a 'BUY' again indeed. Again, the Gold/HUI ratio chart points to severe anomalies between gold and the HUI. This becomes clearly visible when we plot the charts of gold and HUI on top of each other.
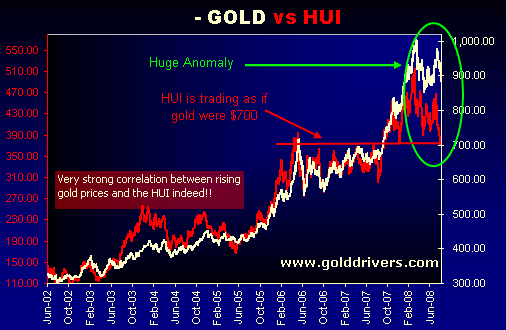
Again we see the severe anomaly between gold and the HUI. The HUI sell-off therefore seems to be way overdone and generates a unique 'BUY' opportunity here. Now let's take a peek at the HUI technicals and what they say. As stated above we've been through this before in December last year when the HUI was being crushed from 460 to 360 within 6 weeks. The bearishness back then was similar as we're witnessing today. Nevertheless I made the case for the HUI to be bottomed out in my piece "HUI – Correction over - December 17, 2007". The HUI rocketed from there to its new all time high of 500+ in March this year. Below you'll see the HUI chart of December 17, 2007:
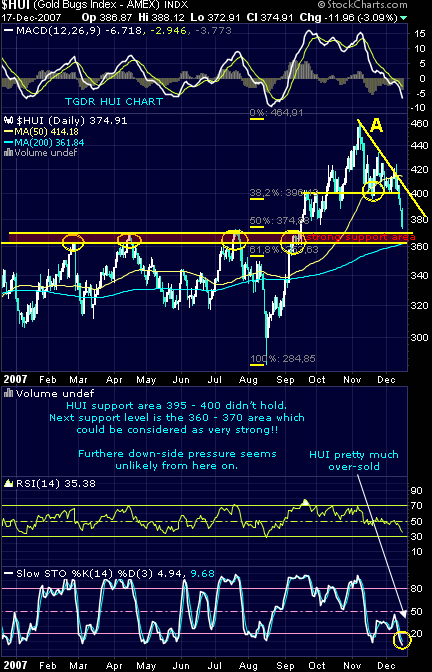
Now fast forward to August 2008. The HUI just made a nose dive towards its long-term support base at the 360-370 area again and many investors are throwing in the towel. The odds are however that the 360-370 support area will serve as a launch pad again for new HUI highs within the next 8 months.
Let's take a peek at today’s HUI chart:

The HUI has approached the strong support area in the 360 -370 range again. The 360 - 370 range has served as a long-term resistance for more than 16 months and serves now as strong support indeed! Furthermore it should be noted that the HUI is pretty much over-sold so further down-side risk seems almost non-existent.
OK, these charts do look encouraging indeed but how can we be sure a major bottom has been reached by now?
Well, sure enough no-one can predict the future here but one of my favourite charts does tell me that if we didn't bottom out now further downside risk seems to be limited to less than 5%!
The chart below shows you the relative HUI chart which has nailed all major bottoms since the beginning of this bull market in 2001.
The r-HUI chart is gold divided by its own 200 dma.It has proven to be a reliable indicator in spotting major bottoms for the gold shares in the past 7 years.

This relative HUI chart clearly touched its green BUY zone . This could mark the bottom for the HUI indeed although a brief return to the green BUY zone can't be ruled out either. The bottom line is that down-side risk is very limited here. Furthermore it should be noted that the relative HUI chart never found itself in the green BUY zone for more than a month. In other words, if we didn't bottom out here it won't take long before we do bottom.
Sure enough the nearby future of the HUI depends on the nearby future for gold so let's take a peek at the gold chart below:
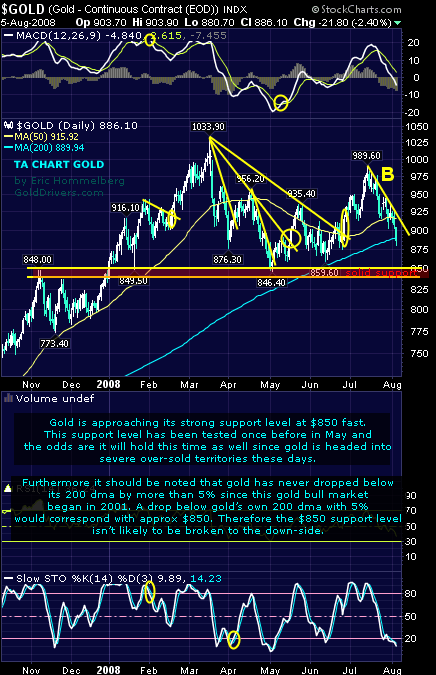
The gold chart above does speak for itself, further down-side risk is limited, a sharp bounce can be expected soon due to gold's severe over-sold condition. When we take a peek at the relative gold chart below, then we'll see that further down-side risk seems limited indeed since gold has dropped below its own 200 dma.
The r-GOLD chart is gold divided by its own 200 dma.It has proven to be a reliable indicator in spotting major bottoms for gold in the past 7 years.
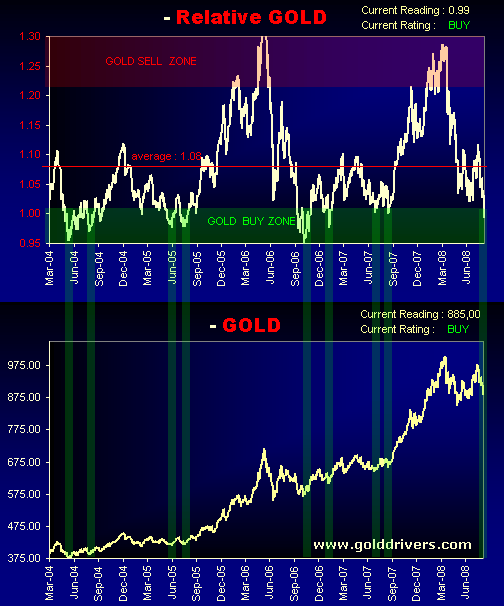
All previous bottoms during this gold bull market so far (2001 - 2008) were being characterized by relative gold values of just below 1. We are here right now again. A worst case scenario would represent the relative gold values dropping further to 0.95 which would translate itself in gold prices of approximately $850. Investing is all about risk/reward. When downside risk drops below 5% it's time to get in again.
This gold bull market is far from over and corrections like these represent excellent entry points.
Next week: Why the gold bull market is not over - Gold & US$
If these charts are helpful you can opt for becoming a GoldDrivers chart member for $5 per month only. You'll be receiving all updated charts used at golddrivers.com on a weekly base. Information can be found at HEREor else at www.golddrivers.com
Furthermore we would like to bring to your attention our new (Free) GoldDrivers Desktop Tool V 3.0 which allows the end-user to be alerted on all Company news, Discovery News, Fastest Gainers, New Editorials etc...More info click HERE or else at www.golddrivers.com
Comments are welcome at:
[email protected]
Eric Hommelberg
The Gold Drivers Report


