The HUI:Gold Ratio at Resistance


Gold stocks have been performing well but I cannot help but notice that the gold sector has reached a major resistance levels on the monthly chart. As much as I would like gold stocks to continue higher we must be ready for a pullback.
I have moved my stops higher to lock in profits from the recent rally in price. If the price breaks down from here I will be sitting in cash having made a decent profit, and I waiting for the next low risk entry point buy or short gold.
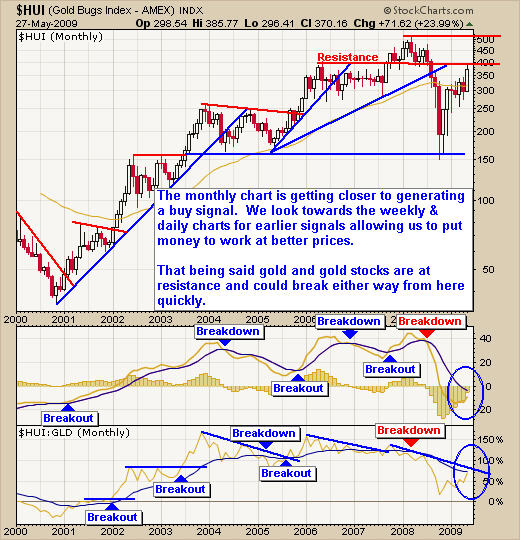
Gold Bugs Index - Monthly Chart
You can see clearly that we are at a resistance level in the monthly time frame. Two things happen at resistance levels. The price eventually breaks though and surges higher or eventually drops like a rock. This is the reason why I am pointing this out. I want everyone to be ready for a quick movement. Either to watch your longs increase in value or to lock in profits if the price breaks down from here. The daily chart helps more with entry and exit points but it's important to remember that the monthly chart is at resistance which holds a lot of power.
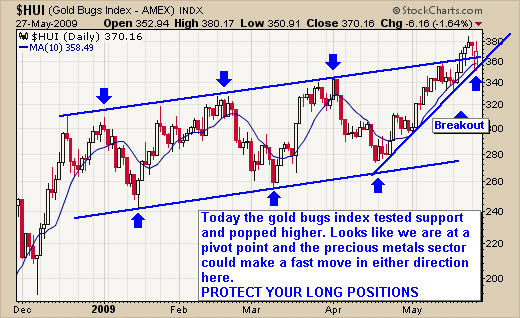
Gold Bugs Daily Chart - Gold Stocks
Gold stocks have been channeling for several months and last week they broke to the upside. As you can see from the chart below the index opened down at the support trend line and rallied to close much higher on Wednesday.
This is a bullish candle but not the type of candle I wanted to see. What I like to see on a bounce off support is a close above the previous days high. This signals there is power behind the move. Today's price action was good but not the best. We want to see sideways or upward movement within a couple days for this trend to continue higher.
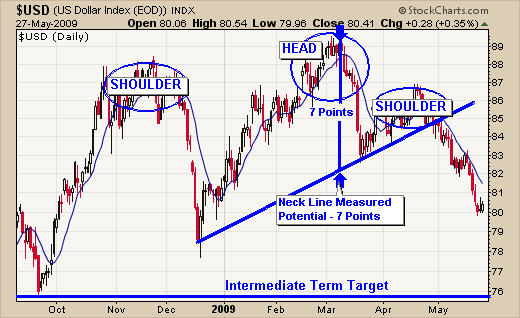
The US Dollar
The US dollar chart looks like a roller coaster over the past 9 months. Currencies now move and trade like stocks/commodities, its crazy.
This chart shows a solid head and shoulder pattern indicating prices could drop as low as 76 within the next couple months. The head & shoulders pattern has proved to be very accurate especially with currencies. We will most likely see some type of bounce at this current level but overall the trend is down.
The falling dollar will help boost the price of gold in US dollars which could give gold and gold stocks that nudge through the current resistance levels.
Active Trading Conclusion
Gold and gold stocks have been moving higher and many of us are long positions surrounding this commodity. I can feel the pressure building in the market with fear of inflation, and the overall economy. Something is going to happen quickly here with gold and the US dollar.
Remember to raise and place your exit orders to lock in current profits on any type of pullback/breakdown.

Chris Vermeulen has been involved in the markets since 1997 and is the founder of Technical Traders Ltd. He is an internationally recognized technical analyst, trader, and is the author of the book: 7 Steps to Win With Logic
Through years of research, trading and helping individual traders around the world. He learned that many traders have great trading ideas, but they lack one thing, they struggle to execute trades in a systematic way for consistent results. Chris helps educate traders with a three-hour video course that can change your trading results for the better.
His mission is to help his clients boost their trading performance while reducing market exposure and portfolio volatility.
He is a regular speaker on HoweStreet.com, and the FinancialSurvivorNetwork radio shows. Chris was also featured on the cover of AmalgaTrader Magazine, and contributes articles to several financial hubs like MoneyShow.com.


