This Indeed Could Be IT!


The time has been creeping down to the end of the half year. The price of gold has dipped down to $1400 and recovered to first hold around $1405. As the last trading day of the half year passed from east to west, the price even improved briefly to $1420, before settling just below $1415. The time is running out for the people who stand to pay if their OTC contracts settle on a London PM fix above the important $1400 level and even a $1425 strike could come into play later today. The price of gold has gone asleep the past 4 hours as if there is no reason for excitement. It is, of course, not only gold that has OTC and other contracts subject to the half year end. It is the one that attracts most of our attention though.
The updated chart of gold’s monthly close below shows that in June gold closed clear above the horizontal longer term resistance trend line that has a value of $1345 and with the May close sitting way back on line Q, at $1295.55. This time the price did not test and test line H, but broke right through to show good strength. It really is beginning to look as if the Big Break in the price of gold is on!
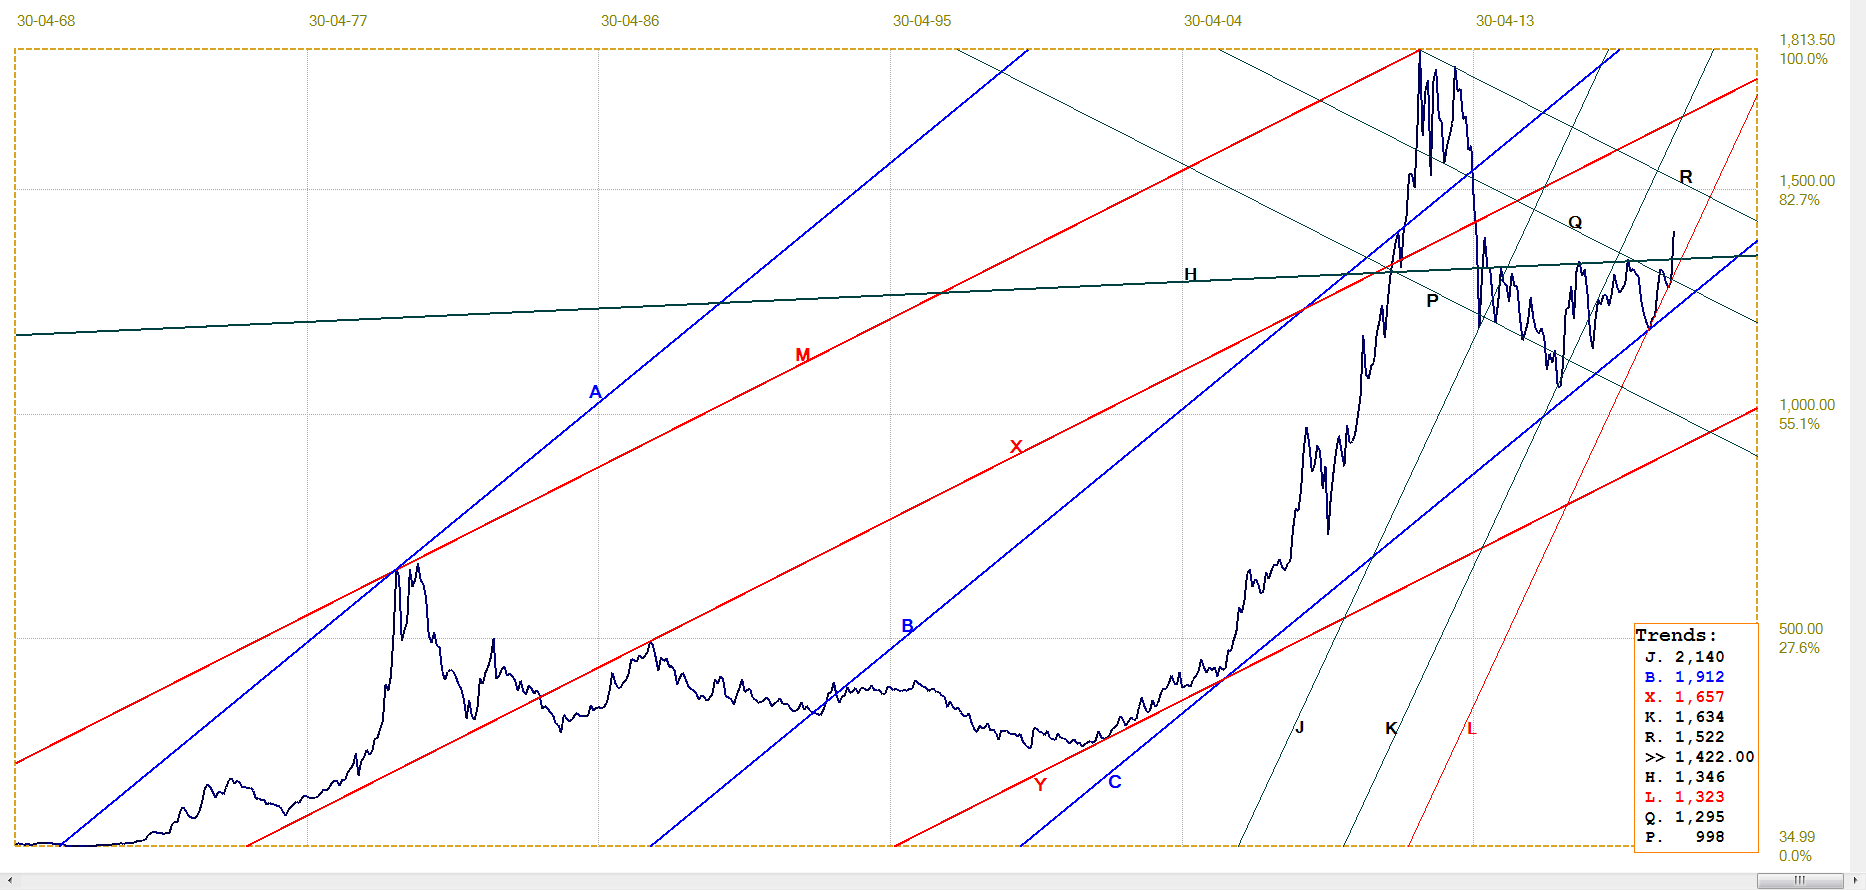
Gold price. Monthly close. Last = $1409.00.
After more than 35 years of looking at the chart patterns and now almost 10 years of intense research, it is clear that these channel patterns are really important for the development of long term charts. One feature that repeats often is that major channels display the Fibonacci ratio – 382:618 – with high accuracy.
Channel ABC has lines A and C tangent to the chart and line B located in the brief high after the break above line X, before the trend resumed. It’s ratio is 384:616, less than 2% off the Fibonacci ratio over a time span of 50 years. Channel MXY, also with outer trend lines M and Y tangent to the chart, have the exact 382:618 Fibonacci ratio. Thirdly, the steeper channel JKL, generated so that the three trend lines fit the chart at three lows, also has the exact Fibonacci ratio.
Nothing is ever certain in markets, but the excellent channel ratios add confidence to this analysis and specifically to the prospect that channel JKL could be projecting the future trend of the price of gold as its next medium to longer term bull channel. If channel JKL really contains the price of gold until the end of 2020, the gold price will end next year above $1500 and possibly as high as $2300.
Investors who have followed the Trump agenda during the past few years have done quite well. Starting with the post election rally and the belief that Trump will MAGA and that this will deliver profits to Wall Street, Trump has ridden a wave of success. He wanted lower interest rates and the bond market – that had turned very bearish under Obama to continue the trend during the early Trump years – at last reversed the trend and set off on an amazing 8 month rally down to 2% on the 10-year Treasury bond. Trump must be smiling as election fever heats up.
Trump also inherited a bullish trend for oil. Prices had been quite low during the last Obama years, but by the time Trump took over, prices in the mid $20 level were long gone and by mid 2017 oil was working on a second leg higher above $50/bbl. Prices continued higher and Trump was getting agitated when they rose to the middle and higher $70s. What Trump wanted, he made sure of getting and with the earth view of the US polka-dotted in close-up with oil jacks on their mounts, the oil flowed and the price dropped. Steeply. It has bounced again, but quickly peaked at a relatively low $65 before dropping again.
Wall Street is however the jewel in his crown. The top in early 2018 was followed by a quite severe correction, which was not given time to take hold before it was reversed – making a new all time high in September. Trump widely used this as a proof that he was indeed MAGA. Then the wheels came off late in 2018. An out of the blue bear collapse took hold of Wall Street.
One would like to believe that Wall Street has bipartisan support – everybody loves a bull run. But when a strong bull market is a powerful plank in the platform of your political opponent, how long before ideology outweighs prudence and loyalties to a common cause? We will probably never know, but I have become very suspicious of the pre-Christmas steep and sudden bear market on Wall Street. The battle for the control of Wall Street was indeed very bitter. The outcome was uncertain, but the bias of the market remained bearish – until the Christmas eve meeting that is said to have co-opted the full weight of the PPT on the side of the bulls. That essentially was all she wrote and the stock market bull returned to health.
So Trump tends to get what he wants and does what is necessary to get it. Now we have to wait and see how the tariff situation with China develops. That should take us a few weeks into summer.
Euro–Dollar

Euro–dollar, last = $1. 1370 (www.investing.com)
The euro finally broke above pennant PW ($1.1065), but is having difficulty holding the break given the recent volatility. Nevertheless, the break is appearing as more solid now and it is looking to be a matter of time before the euro tests resistance at the bottom of bull channel JKL ($1.1481).
A break higher into bull channel KL is not expected overnight, unless some markets received artificial support to maintain certain desired values through the half year end. If that were the case, then there could be some rapid changes by early in July, with the euro among those to benefit.
DJIA Daily close
The DJIA ended June close to a high that forms almost a straight line with the three previous highs. Much of how July begins will be determined at the G20 summit and the meeting between Xi and Trump in Osaka, Japan. The latest news is that tariffs are to be placed on hold as talks are to be resumed. It would seem both politicians blinked at the same time, so that they can claim to their respective constituencies that the other guy blinked marginally first.
It also implies that the game of tweets and hints and nudges and news leaks are to continue to bedazzle the MSM and keep the asset and other markets in suspense.
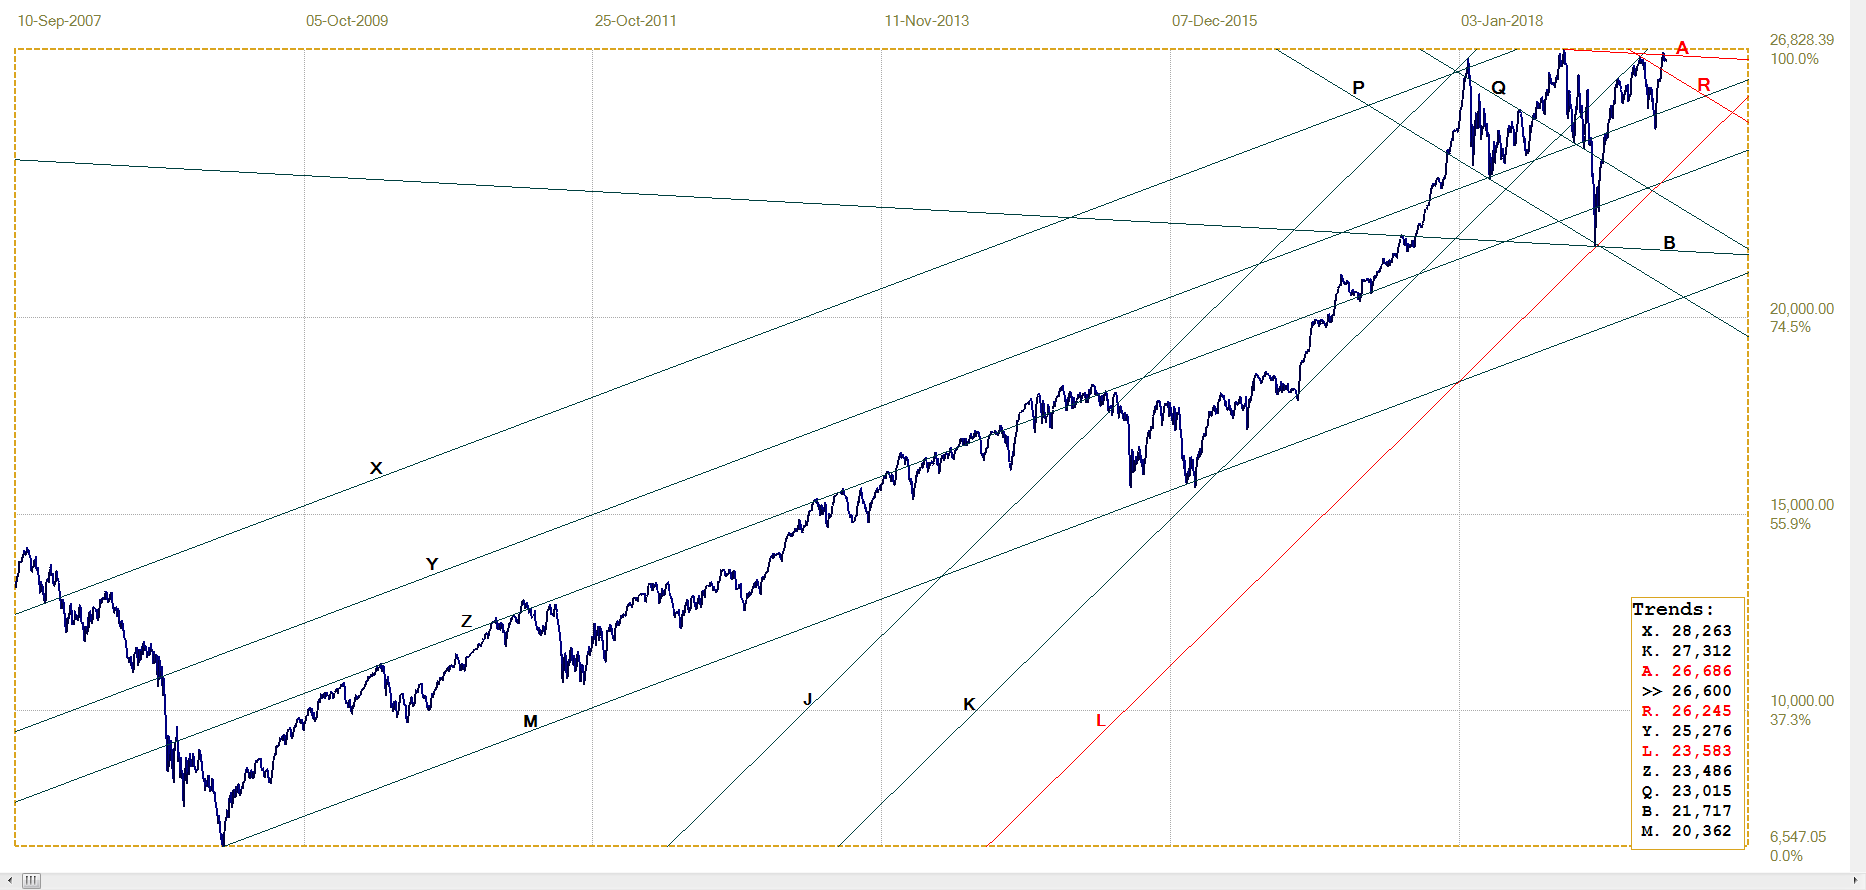
DJIA, last = 26599.96 (money.cnn.com)
Gold London PM fix – Dollars
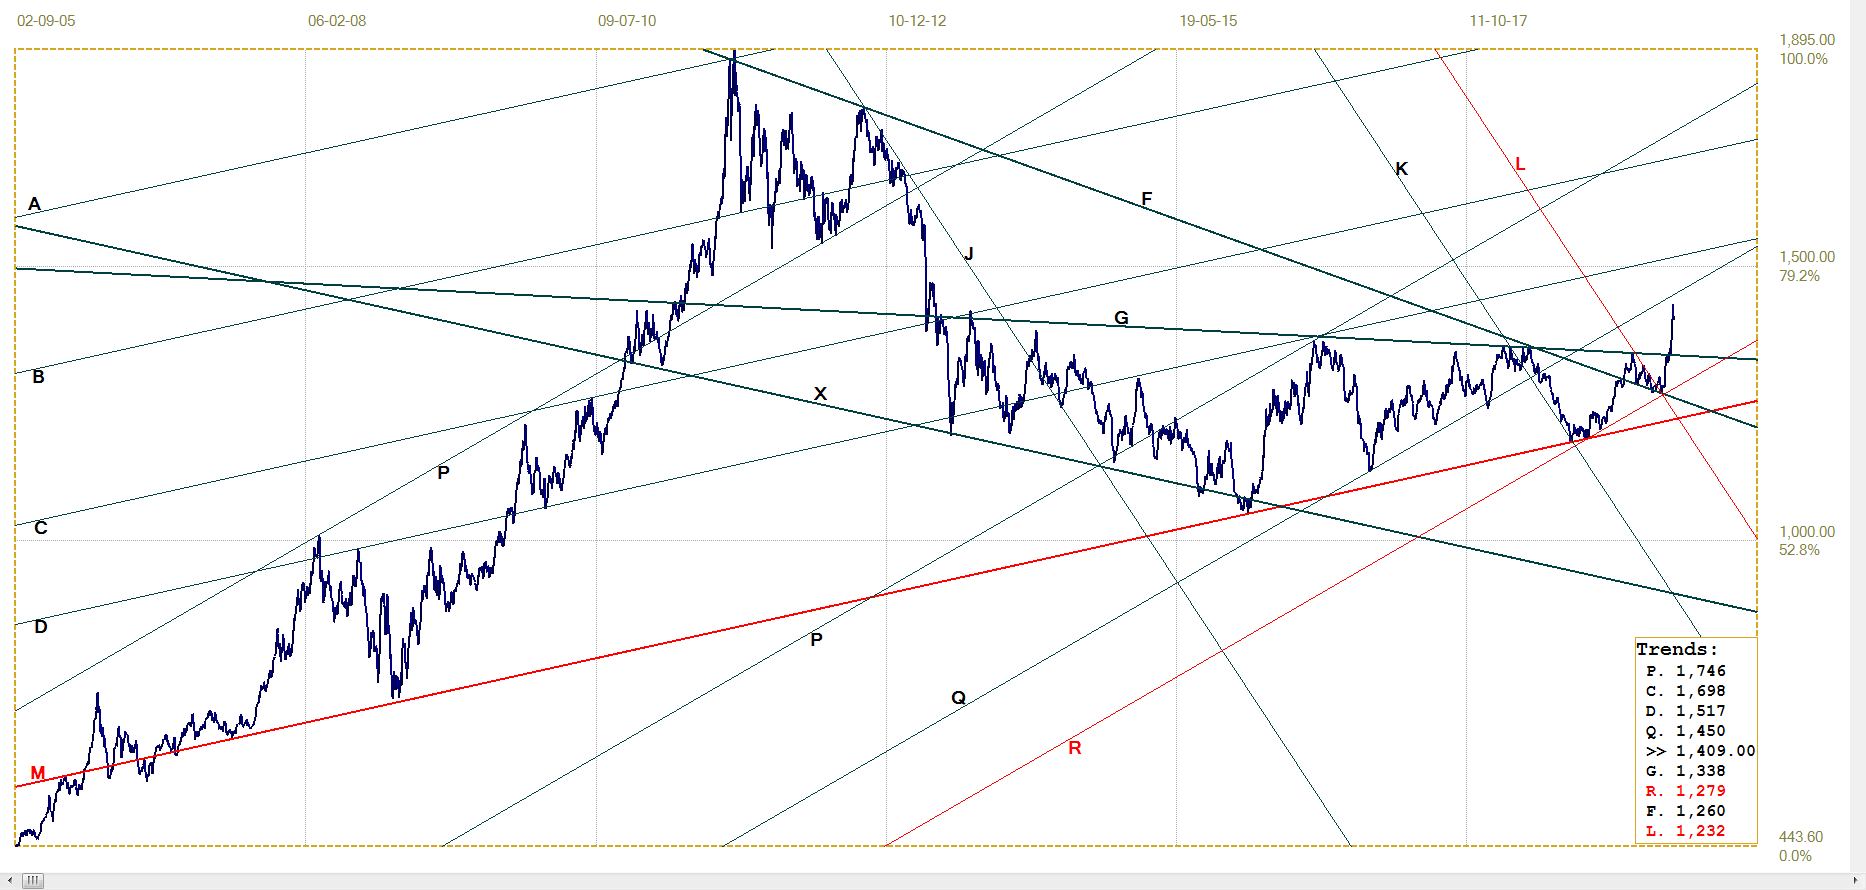
Gold price – London PM fix, last = $1409.00 (www.kitco.com )
The daily and monthly charts show string similarities, with the spike higher since early in June prominent on both charts. The break above triangle MF ($1260) is now truly ‘on’ and one can expect the price to remain bullish – if it were not that expectations with the price of gold so often are not realised; not soon and not ever.
The points in favour of an imminent breakout for gold have been massaged, taken apart and analysed during recent months and it now looks as if the signs and hints correctly meant what observers of gold thought they did. Is it too early to say, “Let the good times roll!”
Euro–gold PM fix
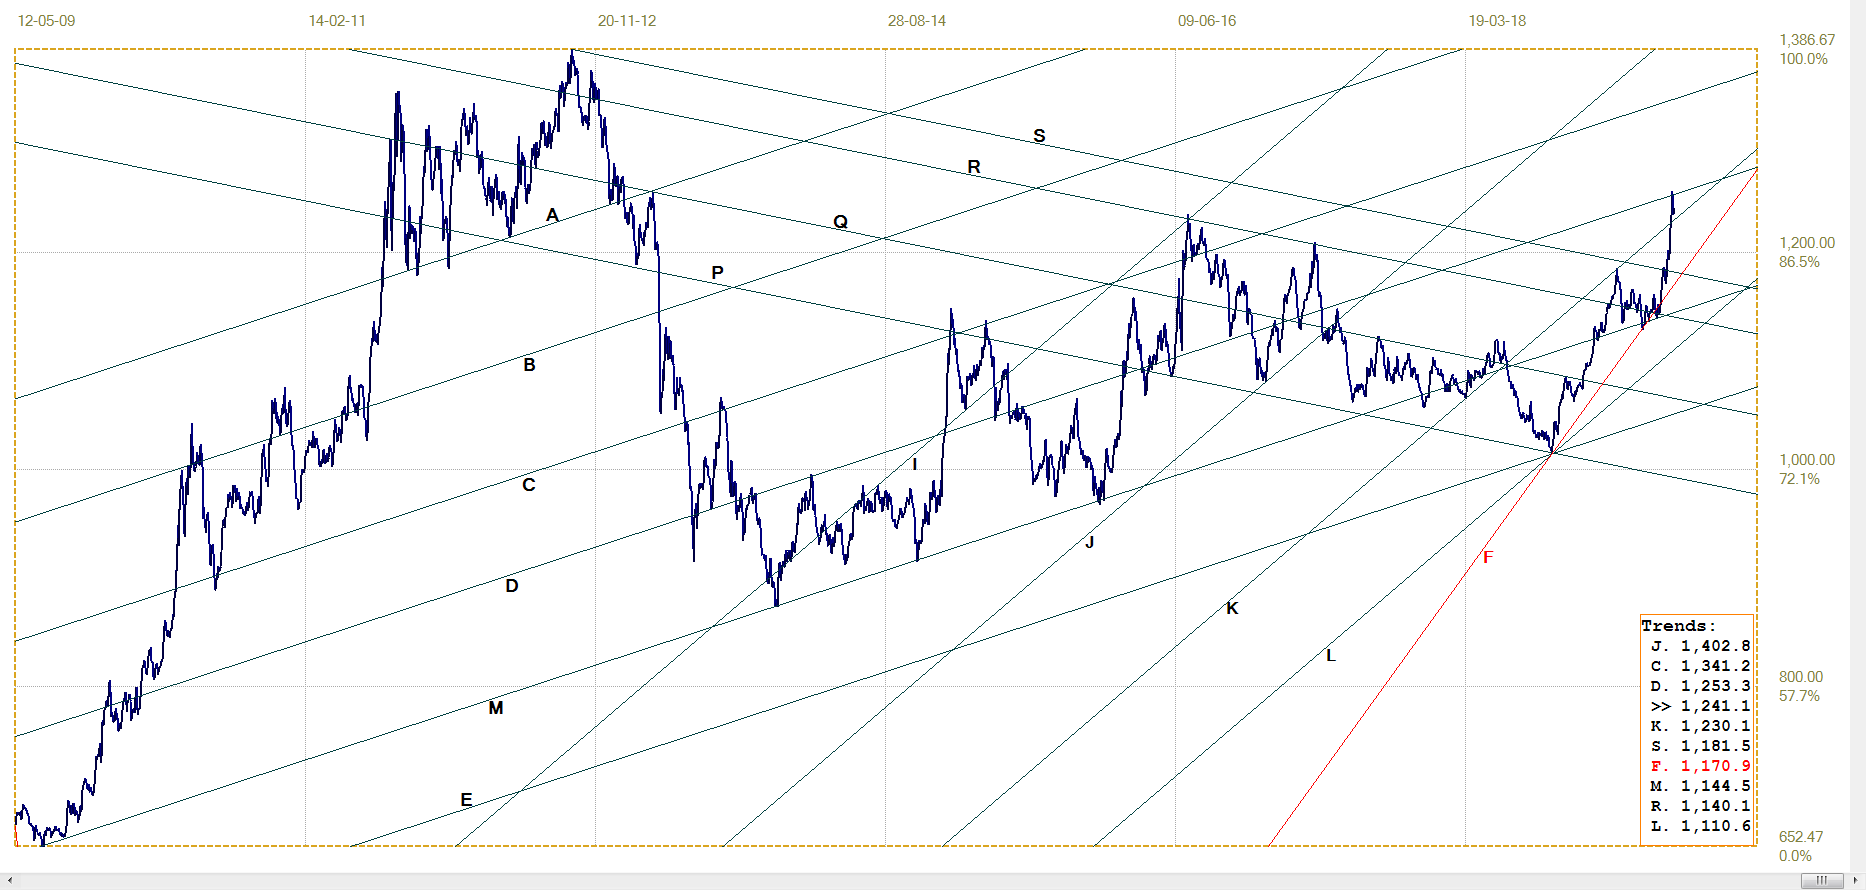
Euro gold price – PM fix in Euro, last = €1241.7 (www.kitco.com)
It was actually a pretty mild half year end and even the typical rambunctiousness of the Quadruple Witch-day was mostly absent. Gold was steady to strong throughout the period and the attacks were brief and rather mild. The dollar los enough ground to boost the dollar price so that volatility in the euro could not dominate the euro price of gold, which showed a steady rising trend.
Holding to the steep gradient of line F (€1171), the euro price soon broke higher from the steep channel KL (€1230) to reach the top of the shallower bull channel DM (€1253). That resistance held and the week closed with a slight reset in the euro price of gold. European holders of gold have to be smiling, since the high price last week is the best gold in euro has managed since March of 2013!
Silver Daily London Fix
Silver daily London fix, last = $15.22 (www.kitco.com)
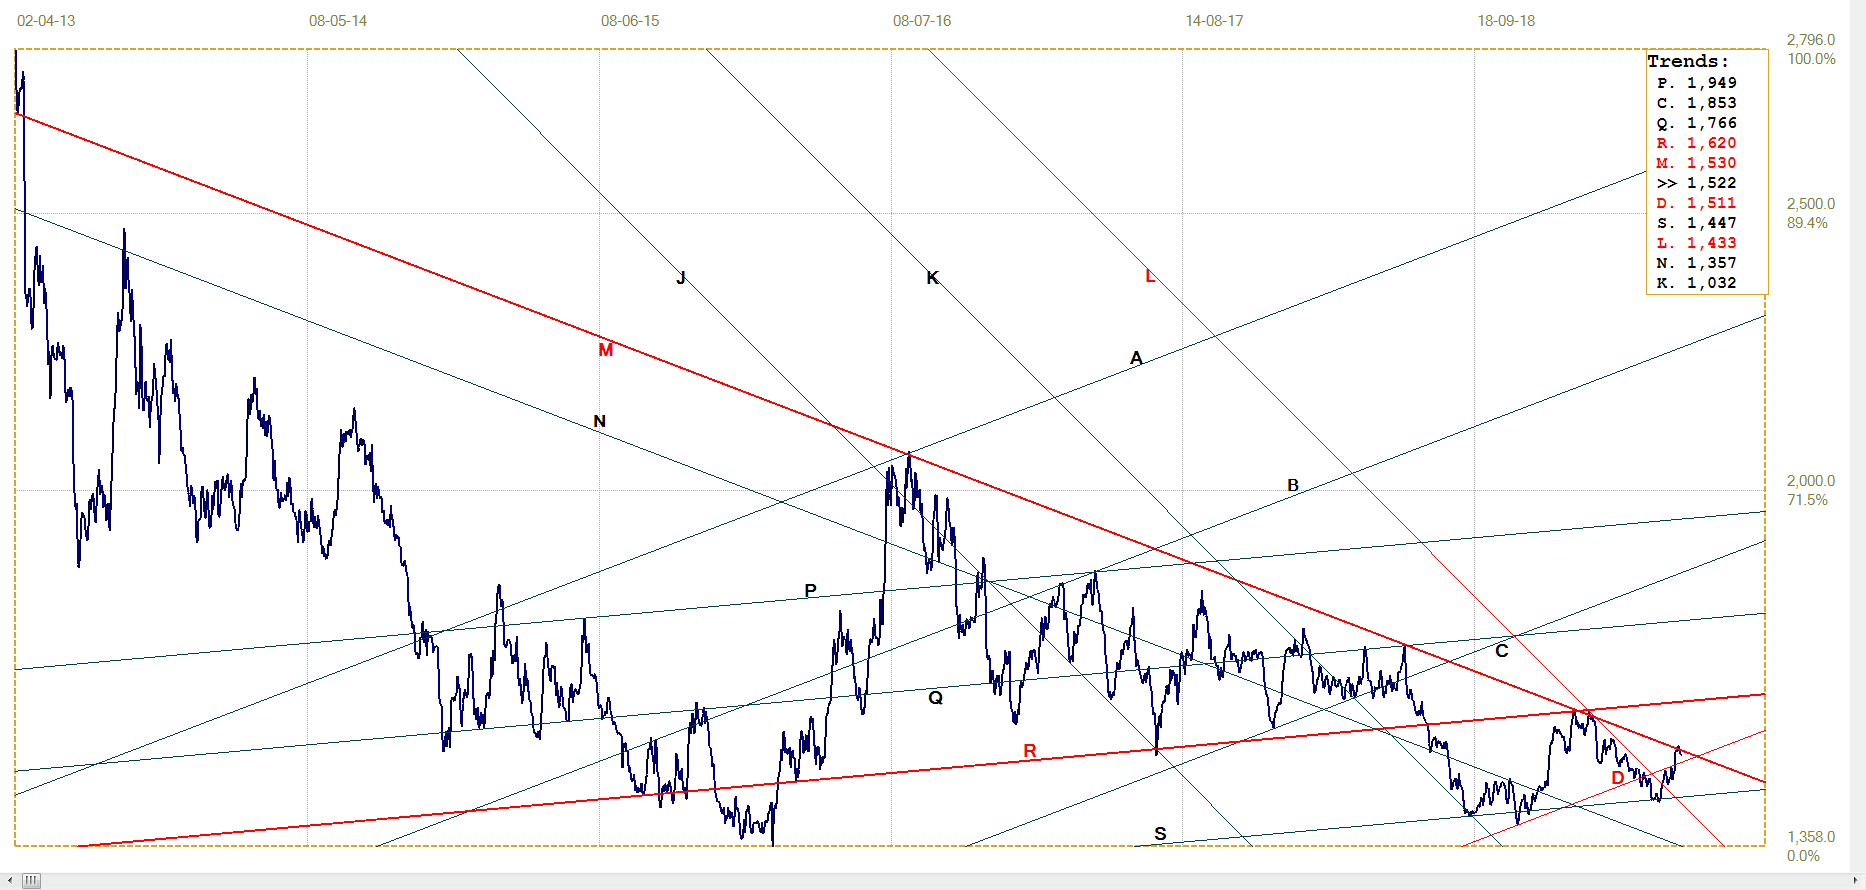
Poor silver, battling on bit by bit to try and make it above the resistance of line M that goes all the way back to April 2013. Now working on the fourth attempt to break higher in 6 years and making heavy weather of it. The period after mid-2016 when silver first was beaten back from line M, sits filled with small spike tops when every small rally was smacked down as soon as it started to become prominent.
Then, in mid 2018, when silver challenged the resistance of line M in full sight of the market to make most silver bulls very excited, large hammers started to land on silver with no letup from $17.23 in mid-June until the price was at $14.13 in mid September – 18% lower and three months later. Setting new lows for the move.
Silver rallied again to challenge line M, which is trend lower all the time, and again was pushed all the way down to the common floor. Yet again silver started to rally, during the past few weeks, and again it is challenging line M, now at $15.30 and not at as far out of reach as in earlier years. Yet again it is being held under tight control as soon as it reaches line M.
It is time for a challenge to succeed, for silver to break above the 6-year old trend line and to set off and challenge the next key resistance at line R ($16.20). It has become time for the Silver Surprise; to reveal what has been so special about silver for so long, that so many bulls were content to sit on their long positions through thick and thin and come what may.
U.S. 10–year Treasury Note
U.S. 10–year Treasury note, last = 2.007% (www.investing.com )
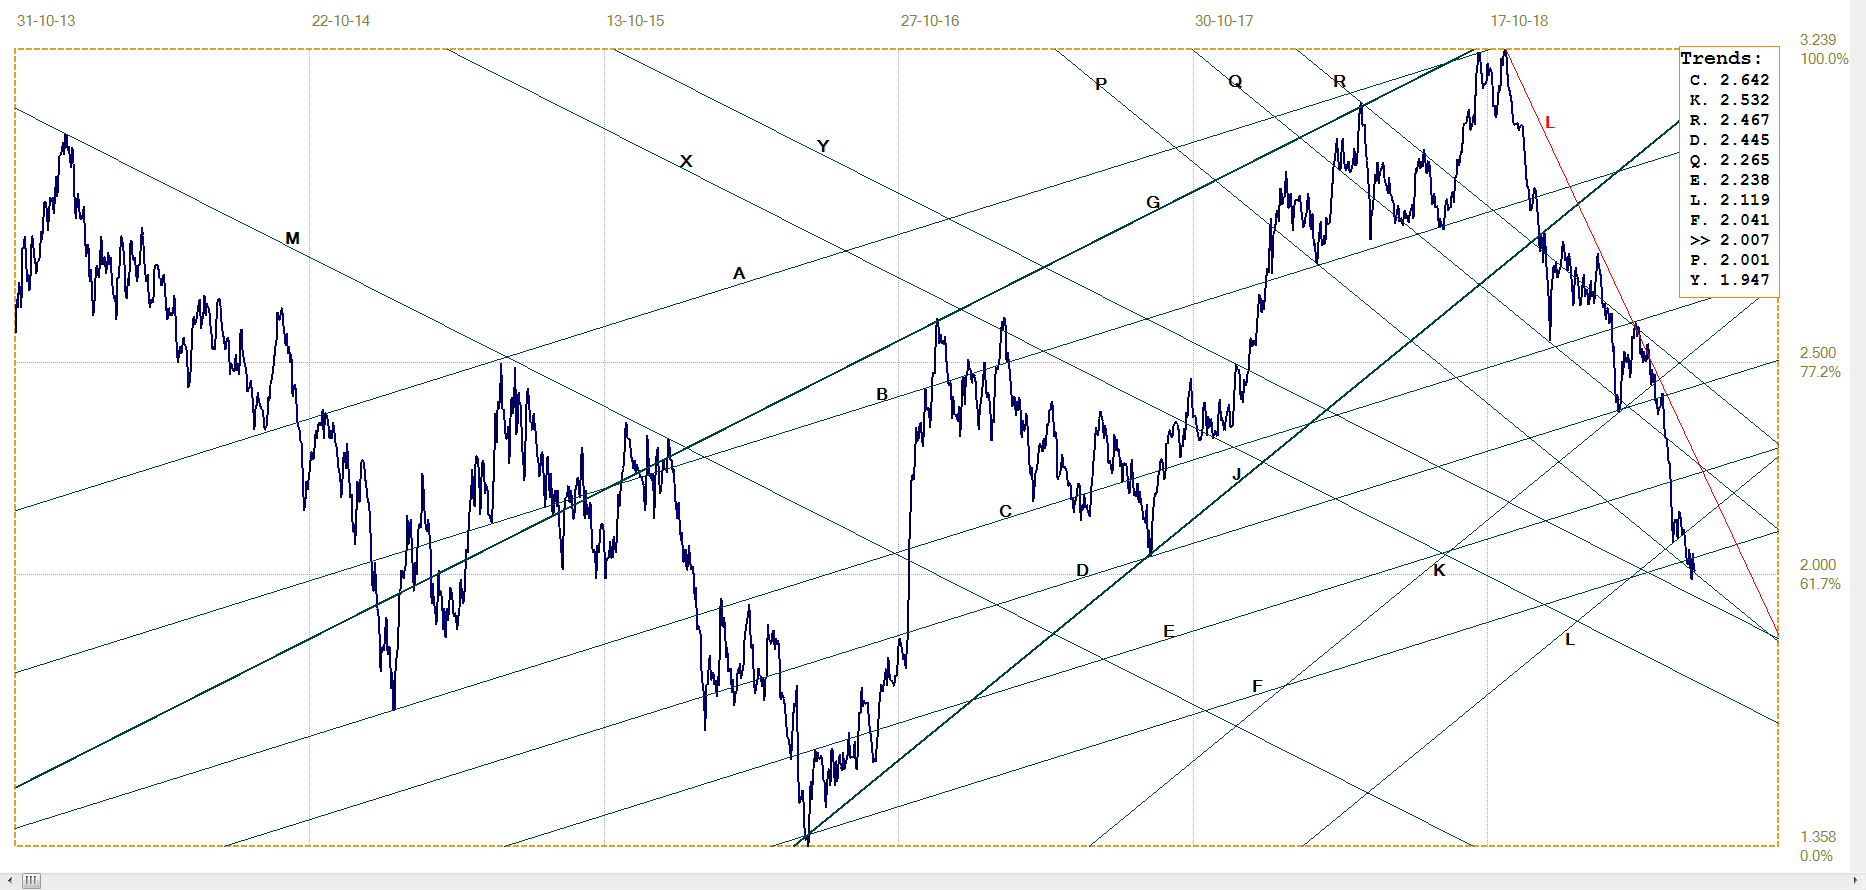
Is the bottom of bear channel AF going to be the end of the steep sustained rally in the bond market that has taken the yield on the 10-year Treasury from the double top at 3.29% in November 2018 down to the recent lows near 2%? It is this rally that inverted the yield curve and sent shivers through Wall Street. The possibility of even lower yields exists, raising apprehension that just perhaps Trump’s firm focus on lower interest rates could see the US join the Sovereign negative yield Club.
West Texas Intermediate crude. Daily close
With lower yields on bonds and a stronger Wall Street, Trump has also expressed keen interest in a much lower price of oil. And it happened. Whenever the price picked up, typically as a result of pressures from abroad, it soon reversed trend to move lower again – almost as a reflex that is independent of the global oil market. Yet these moves manage to hold surprisingly well to the channels and support and resistance levels of the current analysis.
The price has bounced off support at line E ($51.23) and is holding to the steep support of line R ($54.86) with a small break above the steep bear channel VW ($57.57). This break could imply that the trend is expected to remain in place, with the price moving higher – probably to break above resistance at lines K ($63.07) and D ($64.35)
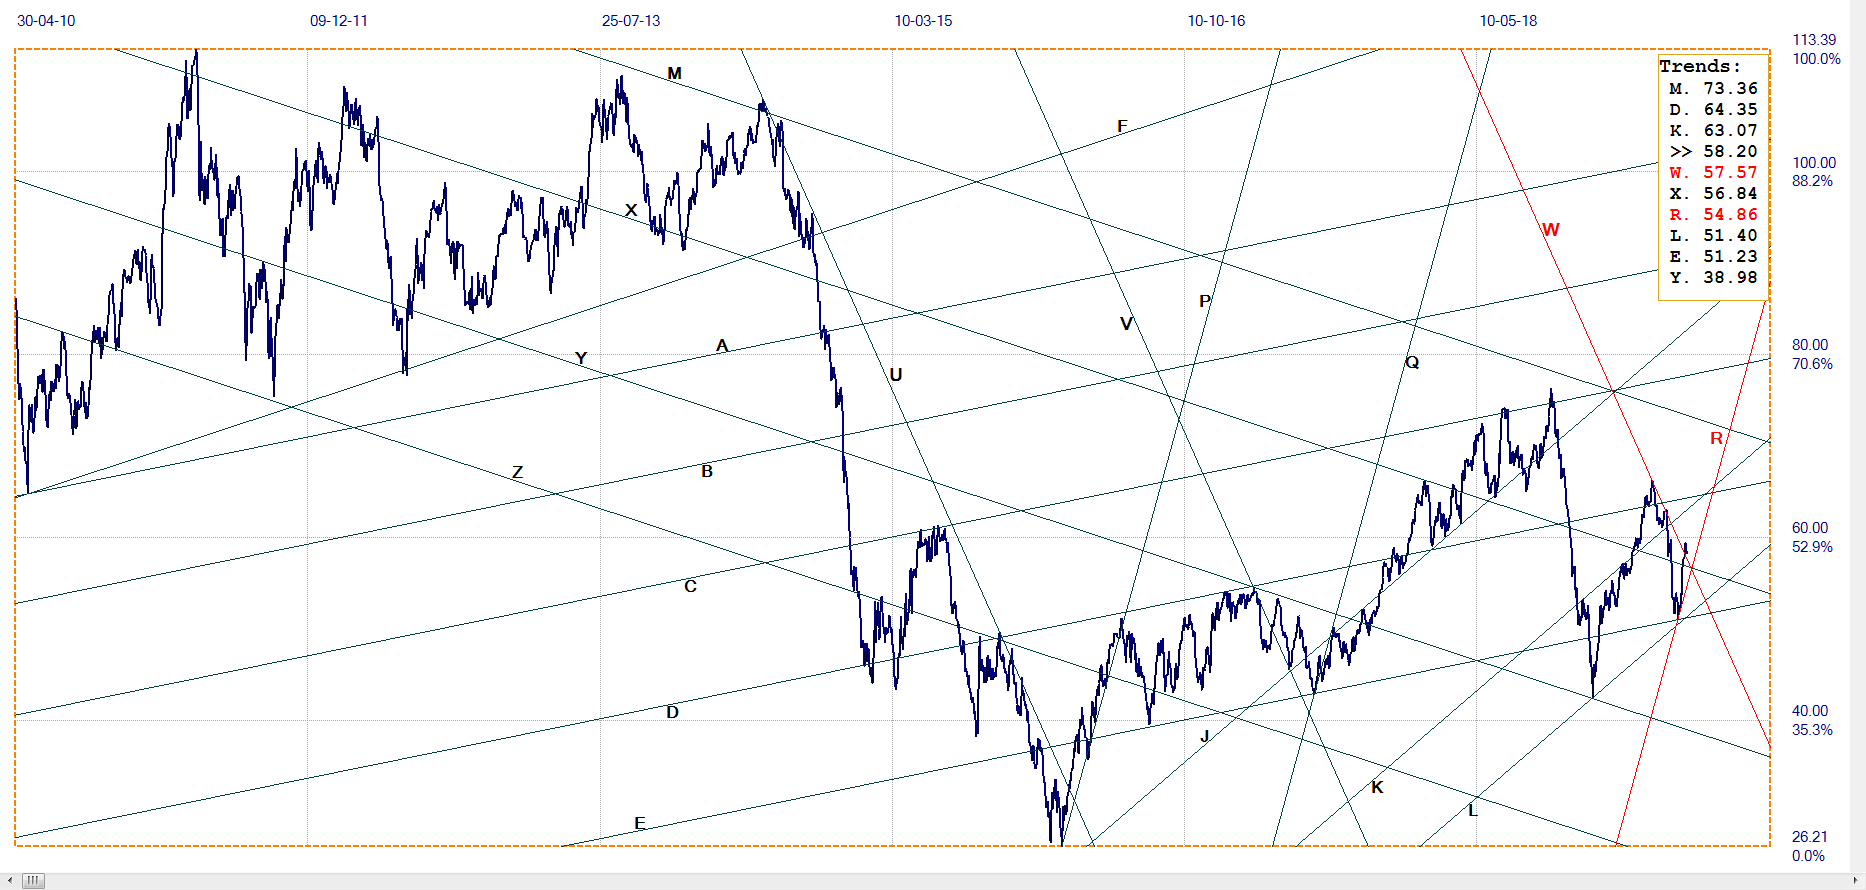
WTI crude – Daily close, last = $58.20 (www.investing.com )
©2019 daan joubert, Rights Reserved chartsym (at) gmail(dot)com
More from Gold-Eagle


