Indian Summer Revisited
The following is a summary of what I believe to be the "macro" economic status quo:
- The gold price is in a Primary Bull Trend and Industrial Equities are in Primary Bear Trends.
- The US Government is acutely aware of the economic risks which are implicit in the above, and is doing everything in its power to stimulate the economy - using a variety of techniques that have worked since 1913 (when the US Federal Reserve was established) - but which have a high probability of failure this time around.
- In essence, these techniques have involved deficit spending, and have embraced approaches which range from government largesse, to tax cuts to waging war/s.
- In turn, these deficits have been largely funded by the US Federal Reserve, which has been the ultimate purchaser of last resort of US Government Bonds - issued for the purpose of financing the deficits.
- The issuance of these bonds to the Fed has facilitated a ballooning of the money supply as money has been on-lent to the commercial banks.
- In turn, this has caused asset price bubbles in both equities and real estate.
- The reason why the "tried and tested" techniques will not work this time around is the same reason why a ballooning of the money supply has not given rise to generalised inflation: Flowing from easy credit, there has been mal-investment, and there is now too much production capacity. Furthermore, consumer markets have become saturated. Consumers are satiated and are wallowing in debt.
- The unhealthy levels of personal debt have been facilitated by easy credit provided by commercial banks which, in turn, have been both able and eager to lend indiscriminately because they have had money virtually thrown at them by the US Fed.
- Inside lending institutions, loans to consumers have been justified by virtue of apparently increasing security cover flowing from a ballooning of real estate prices.
All of the above has led to a growing risk of deflation - a taste of which has already been experienced in Japan.
Against this background I have been arguing that - short term (a year to 18 months) - there is a reasonable probability that the US economy can experience a sort of "Indian Summer" leading up to the US Presidential elections.
Fundamentally, this seems possible for "subjective" as opposed to "objective" reasons. If you want something badly enough you can create an imaginary (temporary) illusion that it is so.
What is the illusion that is being carefully crafted by the politicians at present?
- By "fabricating" and/or exaggerating the Orwellian image of an unseen but pervasive and cancerous enemy, the US Government has managed to keep the economy out of media headlines. The public's attention has successfully been deflected.
- By allowing the US Dollar to drop, the illusion is being created that the US might be able to earn its way out of recession through increasing exports which will be facilitated by lower export prices.
- By the twin actions of:
- contriving (through gaining control over Iraq's oil wells) to cause a fall in the oil price, and
- allowing a fall in the interest rates, the US Government has put a downward pressure on the cost of owning and operating the two most important cost centres (and investments)of the average consumer, namely their houses and their cars.
By tinkering with the tax system (reducing tax on dividends and giving tax rebates), the Federal Government is further attempting to make the US consumer "feel" better about his personal situation.
That 1 - 4 above are "subjective" as opposed to "objective" flows from the fact that the US Government is pandering to wants as opposed to addressing needs. Market demand is temporarily sustainable by satisfying "wants", but is ultimately DRIVEN by needs.
In general terms, the US Government is not addressing market needs and, for this reason, even if the US Government and Fed - working in unison - are successful in artificially stimulating the economy leading up to the Presidential elections, economic activity will wane soon thereafter, and the consumer's parlous position will have been exacerbated. That is why I have been thinking in terms of an "Indian Summer". Conditions might appear to be balmy, but following an Indian Summer the weather typically turns savagely cold.
Is there any evidence that this illusion is being "bought" by the unsuspecting US public?
For an answer to this question we need to turn to the charts:
Investment 101: "Buy low and sell high" What appears (from an historical perspective) to be low in price? How about the Nasdaq?
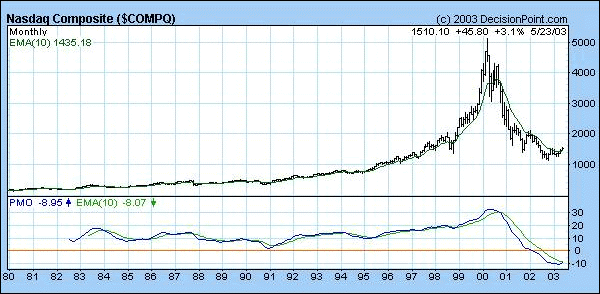
The following monthly chart shows a break UP that occurred in early 2003. (Note how the PMO oscillator is showing a tentative buy signal, and how the price broke up through a down trend line and its 10 month moving average)
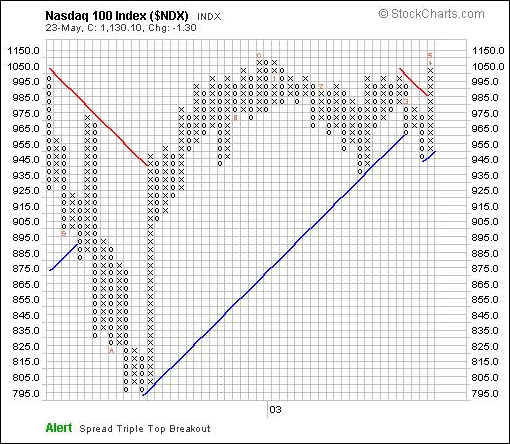
Note also how the Point & Figure Chart has reached a critical juncture. If the 1150 level is broken on the upside, we will be facing a full blow buy signal (not yet occurred but eminently possible in context of the monthly chart above)
Next, look at the "relative strength" chart of the S&P and the Dow Industrials
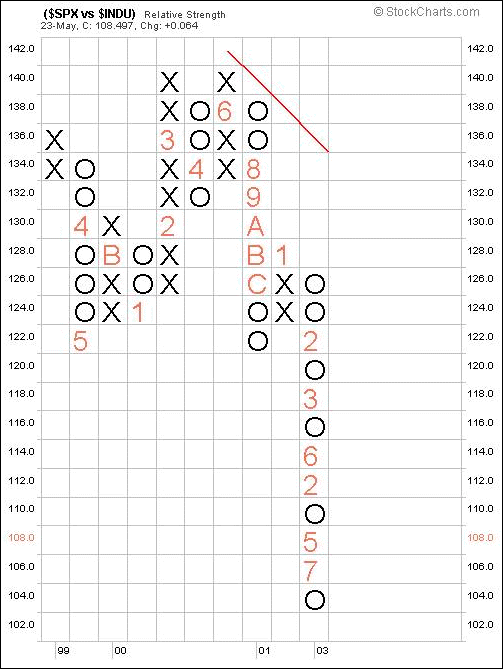
Note how this chart has been showing overall weakness relative to the Blue Chips since the markets peaked in 2000. What this implied at the time was that there was a "flight to quality".
Now, if we ratchet up a bit and look closer at the Dow vs the S&P (other way around) we see an interesting development.
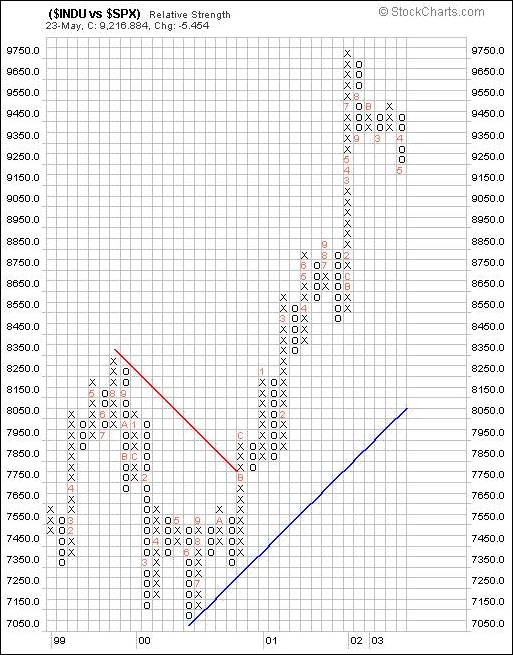
Note how the Dow has recently been weakening relative to the S&P? What this tells me is that the broader market (lower quality) stocks are starting to stir.
If you have ever sat and watched a tortoise you will immediately understand the analogy. As the tortoise begins to believe that the danger has passed, he starts to poke his head out from the safety of his shell.
My guess is that THIS is the reason why the Dow appears to have been lagging the market as a whole. It is not so much that the Dow that has been lagging, rather that the tortoise (broader market) has been tentatively starting to come out of his shell.
But what about the overbought situation and the "Rising Wedges" on the charts? SURELY that is a sign that the markets are about to collapse?
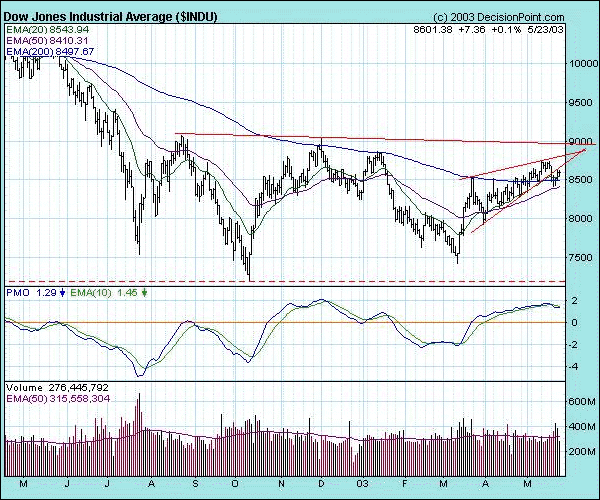
Well, drawing lines on a chart is really a matter of subjective judgment. Look more closely at the above chart and you will notice something very interesting, namely that since April, the price has in fact been moving inside a narrow channel - which has an "angle of incline" that has already been drawn in by the Decision Point publisher. Oho! Note how - if you draw a parallel line from the bottom in March - it appears to have provided support two days after the price apparently broke down from the rising wedge. In short, the angle of incline appears to be intact.
As an aside, because "technical analysis" is now available to the masses, the rising wedge and the overbought oscillator have been "blindingly obvious" - even to rank amateurs. Whilst I am not yet prepared to say that the wedge is not a "typical" wedge (which could lead to a pull pack all the way to around 8000) I AM prepared to say unequivocally that the prevailing angle of incline is still intact.
What about the "overbought" oscillator? Again, overbought is a matter of perception. Note how the PMO fell as low as -5 when it turned from man oversold position. In this context, at a current level of less than +2 it can hardly be argued to be in rarified territory.
What about volume?
This one is VERY tricky
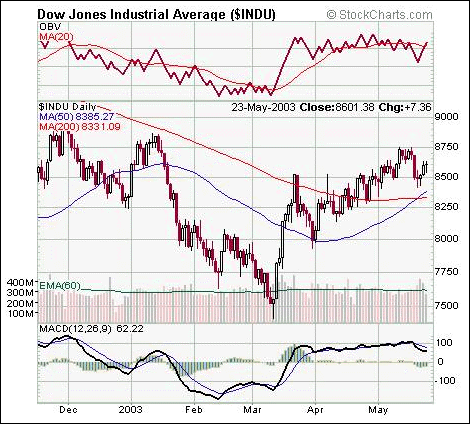
Note how the On Balance Volume gave a sell signal at the same time that the rising wedge broke down and the MACD gave a sell signal.
SURELY, this is justification for a conclusion that the market is about to pull back sharply? Also, not how volume tailed off in the past two days even as prices rose. Don't the text books tell us that this is bearish?
The answer is absolutely "yes" - but my "gut" is telling me otherwise.
What is my gut telling me?
It is telling me that with M3 having exploded in the past few weeks, and with the steepness of the rebound in the OBV chart - there may just be too much "weight of money" sitting on the sidelines for "conventional" charting techniques to apply - especially when there are literally millions of chartists following these conventional techniques. My gut is telling me that in this particular case the angle of incline is the prevailing technical measure, and that the market will quite possibly whipsaw to burn a large number of short sellers.
Clearly, it is dangerous to try to outsmart the market, and equally clearly, there is no certainty on a day-to-day basis. And, of course, I might be wrong.
However, from my perspective, all of the above is academic. What I am really focussing on is the following question:
Is there anything that the US Government could be doing to avoid a Depression that seems virtually certain will follow the coming Indian Summer (if the latter manifests at all)?
The answer is "YES, I BELIEVE THERE IS" - which is ultimately why I have been writing these GOLD-EAGLE articles.
The solution to the problem lies in addressing the NEEDS of the market. Where are these needs?
- Ageing populations (Health maintenance infrastructure)
- Potentially pandemic illnesses such as AIDS, and SARS (ditto).
- Environmental pollution (Water and air treatment. Superconductors, Fuel Cells, chemical free water disinfection)
- Education (Teaching people how to think as opposed to how to pass examinations)
- A stable - and honest - financial infrastructure (gold standard)
As I see it, we are running out of time. If Governments (world-wide) were to invest capital wisely in the above during the Indian Summer, they might be able to put in place sufficient of an infrastructure so that the foundation of a "truly new economy" may be put in place.
It's time for the politicians to act with integrity in the interests of all.


