Investment Trends for 2006


Happy new year and wishing you all peace and profits in 2006.
As always at this time of the year, there is a whole lot of noise about where the markets are heading, because of this and that. Our focus is on price action, and we follow the price action of major trends. Since we are not smart enough to tell you why, we are content to have the ability to tell you when.
Papers vs Things
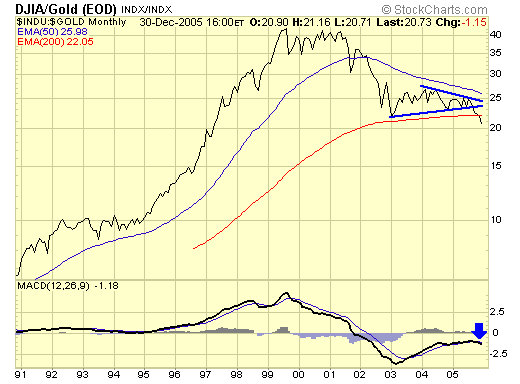
It is common knowledge that these two asset class have an inversed relationship, and we can see that clearly from the Dow/Gold performance ratio chart. Things began to outperform papers since 2001, but that out-performance halted since 2003, until late 2005 when things began its dominance once again. Some analysts interpret this as a sign that the Dow will crash and gold will go to the moon, it may happen that way, and it may not. But the fact is the ratio between papers and things are narrowing, has been since 2001 and will be for the foreseeable future. As market participants, our job is to position ourselves accordingly.
Things vs Things
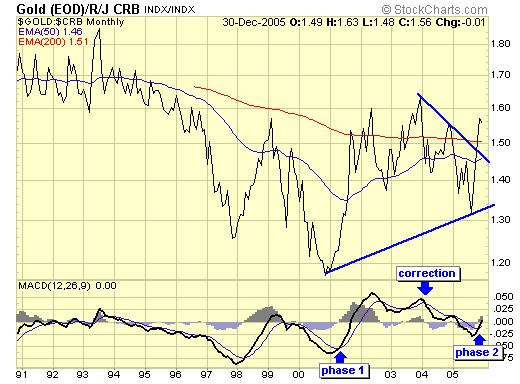
$CRB is a commodity index, a "things" index. Gold is not only outperforming paper assets, it is also outperforming other things. The two year correction is now over, and gold's dominance over other things has begun once again.
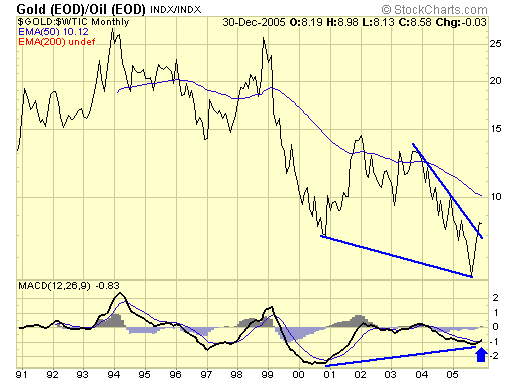
One of the things which is heavily weighted in the $CRB is crude oil, and gold's rise since bottoming at $255 was nothing comparing to the dominance of oil, when it reached $70 in late August. But that dominance by oil appears to be over as the massive bullish divergence has broken oil's dominance in late 2005.
Papers vs Papers
Obviously, owning hard assets over paper assets is preferred for the foreseeable future, but for the average investor, owning physical gold is out of the question, therefore, paper gold is the next best thing.
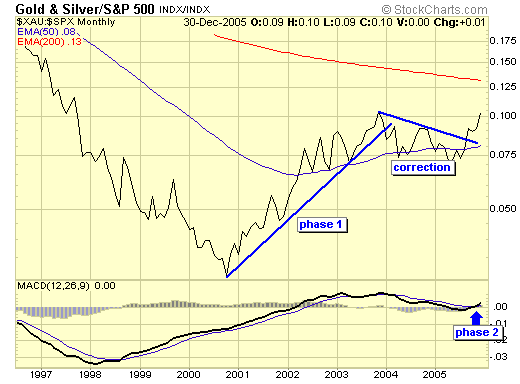
Some of you have seen this chart from my previous articles, and it is self explanatory. Paper gold is outperforming the SP500 again after a two year correction.
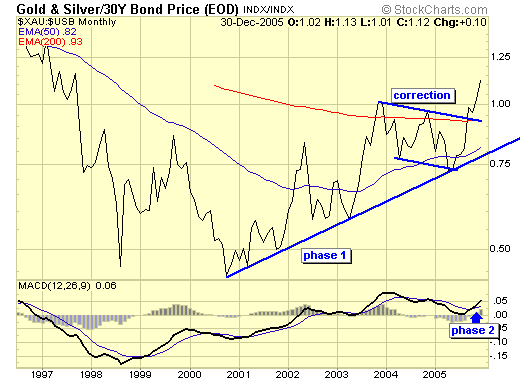
Paper gold is also outperforming long bonds again, after a two year pause.
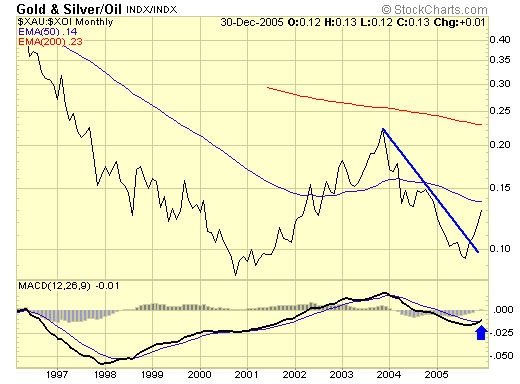
Paper gold is outperforming paper oil once again after a sharp retreat the past two years.
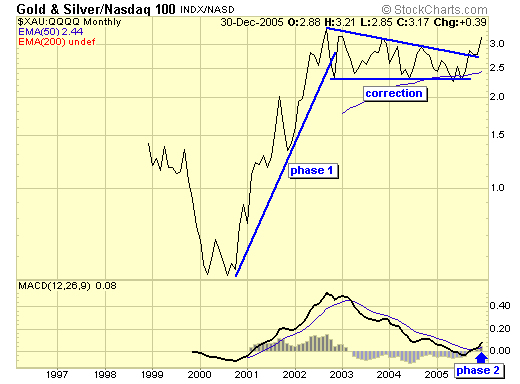
But the most striking out-performance comes from paper gold vs the cube, and what lies ahead as the two year correction has ended with a major breakout in late 2005. Elliott-Wave fans would call this wave 3, the most powerful wave within a bull market and wave 3 always exceeds wave 1. You do the math.
Summary
Technical analysis is not about predictions and forecasts, because the markets are dynamic and subject to constant change. The best we can do is to utilize TA to aid us in positioning ourselves, in favor of current major trends, until proven otherwise. Many subscribers have asked me the reasons for my allocation favoring the gold sector over the energy and technology sector, perhaps you can now see why.
Keep it simple, and follow the markets.
Jack Chan at www.traderscorporation.com
6 January 2006

Jack Chan is the editor of Simply Profits, established in 2006. Chan bought his first mining stock, Hoko Exploration, in 1979, and has been active in the markets for the past 37 years. Technical analysis has helped him filter out the noise and focus on the when, and leave the why to the fundamental analysts. His proprietary trading models have enabled him to identify the NASDAQ top in 2000, the new gold bull market in 2001, the stock market top in 2007, and the US dollar bottom in 2011.


