Junior Gold Stocks: Textbook Volume
 share
share
 share
share
 share
share
 share
share
 share
share
The US government is finally releasing the jobs report today. Most institutional players are expecting the report to show that about 180,000 new jobs were created in September.
Many analysts believe this report is not too important, because data may be missing due to the government shutdown.
Regardless, if the report shows 200,000 (or more) jobs were created, I expect “taper caper” talk to begin again, and that could put a bit of pressure on gold prices.
If the report shows very few jobs were created, gold should surge higher.
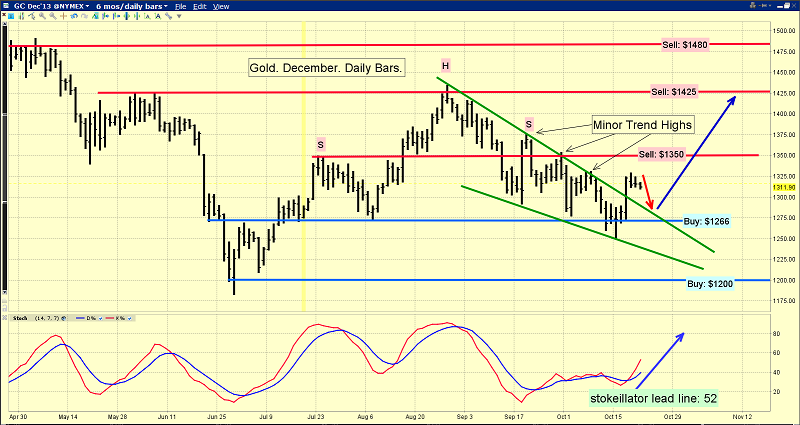
That's the daily gold chart, and from a technical perspective, gold and silver look quite good.
Gold has staged an upside breakout from a bullish wedge pattern, and my stokeillator (14,7,7 Stochastics series) is in a rising mode.
An uptrend is defined as “rising highs and rising lows”. Gold needs to rise above the minor trend highs of $1330, $1351, and $1375.
$1375 is a particularly important price area, because it represents the right shoulder high of the head and shoulders top pattern that many gold bears are focused on.
A move above $1375 would destroy the top pattern.
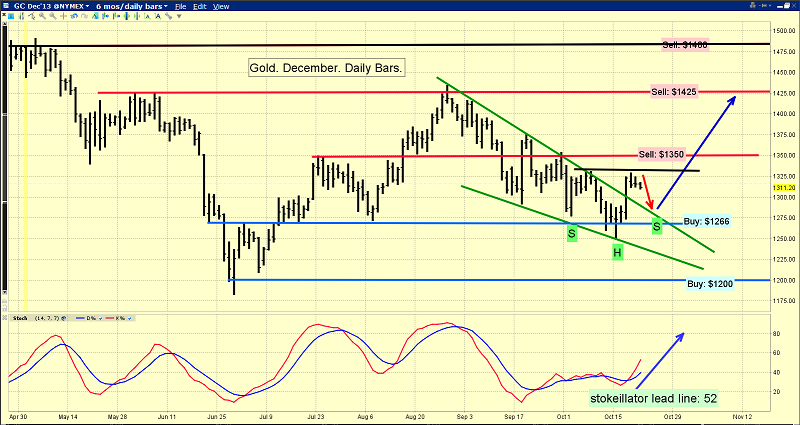
That's another look at the daily gold chart. If the breakout from the wedge pattern is real, gold could easily pull back to the $1300 area, or even lower, before moving higher.
That pullback could make the chart more bullish, because it would create an inverse head and shoulders bottom pattern, with a target of $1400 - $1425.
If gold can rise above the highs near $1432, many momentum-oriented investors would likely buy gold, and that would add more upside pressure to the price.
I believe that gold is likely to trade at $1480 before it trades at $1180.
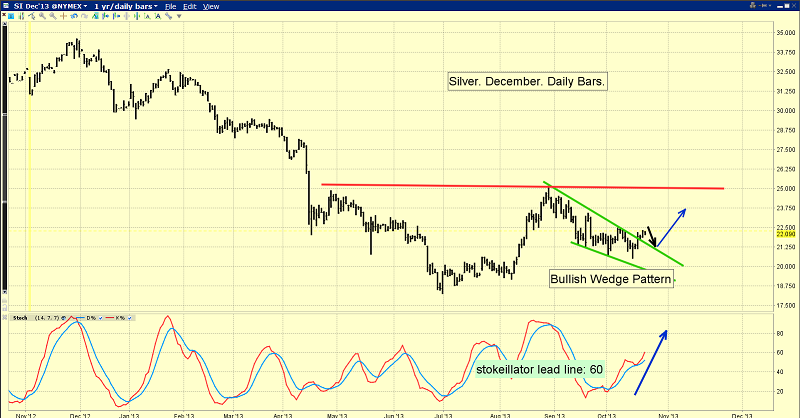
What about silver? This daily silver chart is very bullish. If silver can rise above $22.50, I think momentum players could push the price to the key $25 HSR (horizontal support and resistance) area.
Arguably, both senior and junior gold stocks are even more bullish than the metals are.
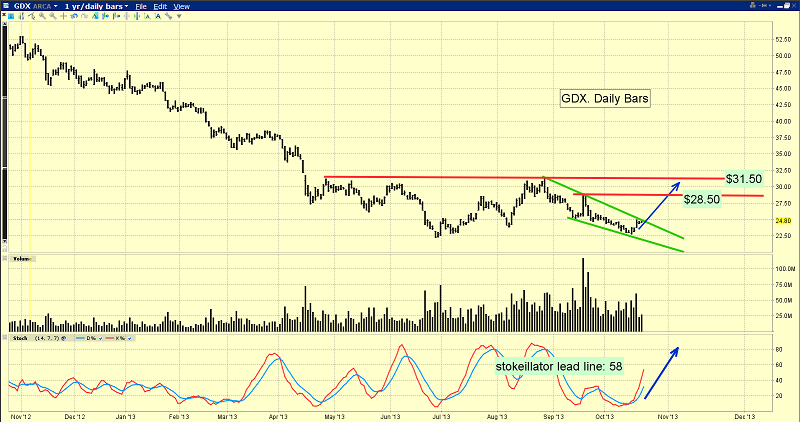
You are viewing the GDX daily chart. Note the HSR line that I've highlighted in the $28.50 area. That line is important because these are the highs that were created by the Fed's “no taper” statement.
Trading volume surged as those highs were made, so $28.50 is clearly a key price that big players are focused on. If GDX can stage an upside breakout from the green bullish wedge pattern, an assault on the “no taper” highs is very likely.
It could be argued that there is also a substantial double bottom pattern in play, with the first bottom defined by the July lows in the $22.50 area, and the second bottom defined by the lows in the same price area that were made just a few days ago.
The neckline is the HSR zone at about $31.50, and the upside target of the pattern is $40.
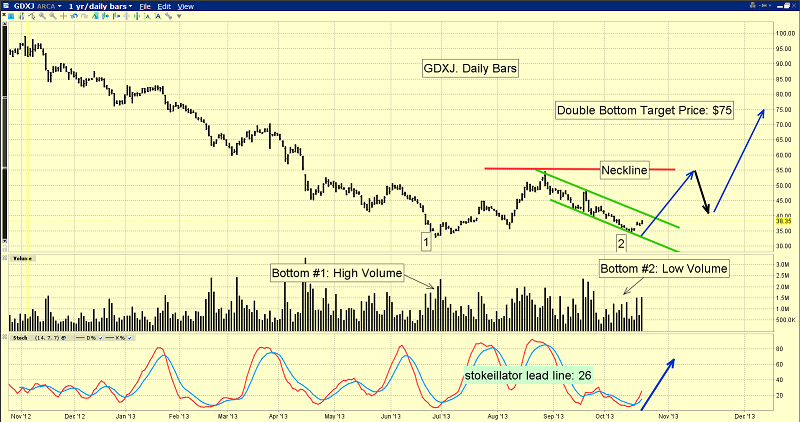
The same double bottom formation is apparent on the GDXJ chart, and the trading volume pattern is excellent.
Double bottom patterns are reversal patterns, and they usually precede substantial intermediate or primary trend movement.
A classic double bottom pattern tends to be defined by high volume on the first bottom, and low volume on the second bottom.
That's certainly the case here, with GDXJ! Many individual stocks show similar chart formations, which is great news for junior gold stock investors.
The technical target of the GDXJ double bottom pattern is $75, and the “launchpad” is likely a 3 day close above $55!
********
Special Offer For Gold-Eagle readers: Send me an Email to [email protected] and I’ll send you my free “Base Metals & Cost Push Inflation” report. I'll show you why the chart action of some key base metal stocks suggests that the world is beginning the transition from deflation (wealth destruction) to inflation.
Email: [email protected]
Mail to:
Stewart Thomson / 1276 Lakeview Drive / Oakville, Ontario L6H 2M8 Canada
Risks, Disclaimers, Legal
Stewart Thomson is no longer an investment advisor. The information provided by Stewart and Graceland Updates is for general information purposes only. Before taking any action on any investment, it is imperative that you consult with multiple properly licensed, experienced and qualifed investment advisors and get numerous opinions before taking any action. Your minimum risk on any investment in the world is: 100% loss of all your money. You may be taking or preparing to take leveraged positions in investments and not know it, exposing yourself to unlimited risks. This is highly concerning if you are an investor in any derivatives products. There is an approx $700 trillion OTC Derivatives Iceberg with a tiny portion written off officially. The bottom line:
Are You Prepared?
share
share
share
share
share
 Stewart Thomson is president of Graceland Investment Management (Cayman) Ltd. Stewart was a very good English literature student, which helped him develop a unique way of communicating his investment ideas. He developed the “PGEN”, which is a unique capital allocation program. It is designed to allow investors of any size to mimic the action of the banks. Stewart owns GU Trader, which is a unique gold futures/ETF trading service, which closes out all trades by 5pm each day. High net worth individuals around the world follow Stewart on a daily basis. Website: www.gracelandupdates.com.