Key Message For Gold And U.S. Stocks


Last week's trading saw gold forming it's low in Monday's session, here doing so with the tag of the 1692.10 figure (June, 2020 contract). From there, a sharp rally was seen into late-week, with the metal running all the way up to a Friday peak of 1761.20 - before backing slightly off the same into the daily/weekly close.
Gold's Short-Term View
From my comments made in recent articles, gold was expected to undergo a series of correction in the days/weeks weeks ahead, with the last of these coming from the combination of 10 and 34-day cycles. In terms of time, our focus was on the early-May region to complete the last short-term low. Here is a look at the most dominant cycle that we track, the 34-day wave:
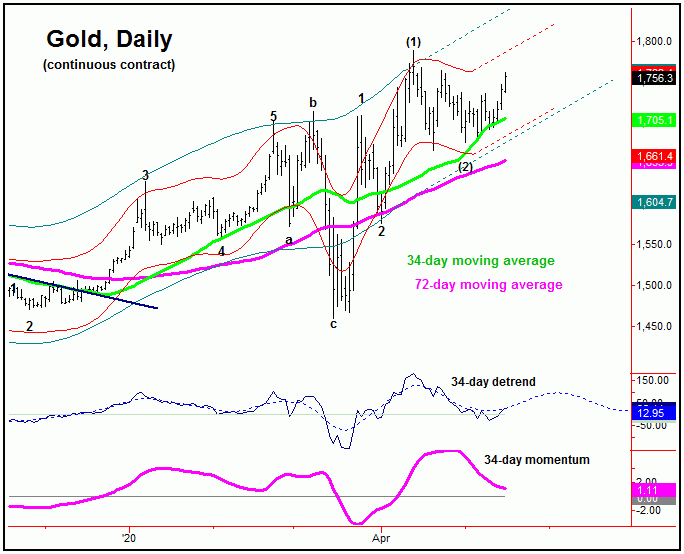
In terms of time, the trough for this 34-day component was ideally due around the first week of May, plus or minus. In terms of price, our expectation was for a decline which took the metal back to it's rising 34-day moving average - with that same moving average also providing key support to the downward phase of this wave.
With our 34-day chart, we can see the recent decline coming down to our 34-day moving average, which acted as support for the move. Using this information, we were able to go long a small position in the GLD (i.e., Gold ETF tracking stock) into early-Monday of last week, doing so at the 159.46 figure (approximately 1696.00 for the price of gold).
With the above said and noted, the shorter-term view is that the 34-day wave has likely bottomed out with the recent action - and with that is headed higher in the coming weeks, then to set up a more significant price peak, expected to come from our next larger wave, the 72-day cycle, shown again below:
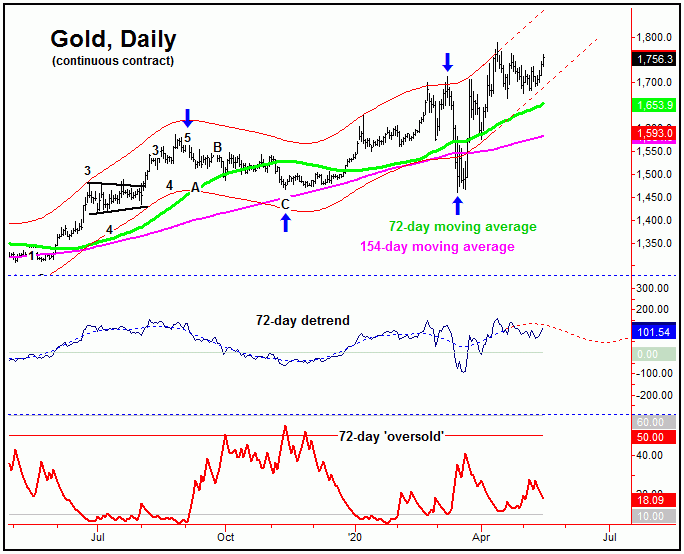
On our 72-day chart, of note is that the channels that track this wave are still pushing higher at the present time - which should support the view for additional strength in the coming weeks. From there, however, this cycle should top-out once again, giving way to a larger-percentage decline into what looks to be the month of June, with more exact details of how this decline should play out noted in our Gold Wave Trader market report.
Gold's Technical View
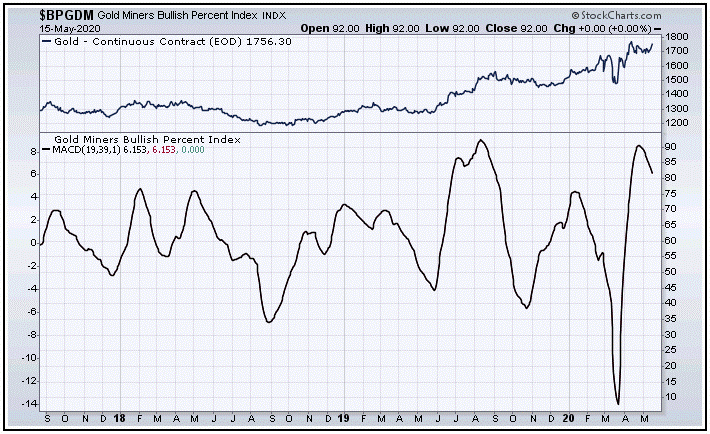
In terms of technical action, as noted in past articles, our Mid-Term Breadth index for gold (chart, below) has recently turned to the downside - which is a headwind going forward. While this does not mean that the metal can't and won't continue to rally, we ideally want to see this indicator trending to the upside, coming off a low level. Overall, the action of breadth suggests that the upside in the days/weeks ahead will be fairly limited to only a marginal new high, at best. Here is that breadth chart:
Gold's Long-Term View
Going further with the above, the patterns with the 72-day cycle do favor the next downward phase of this wave to end up as a countertrend affair - against the prior 72-day trough, registered back in mid-March. In fact, the decline into the next 72-day trough may be the last real good buying opportunity of this year for longs.
For the longer-term picture, the largest cycles that we track are the 310-day wave and the larger four-year component. Here is the smaller of these two waves, the 310-day component, shown again below:
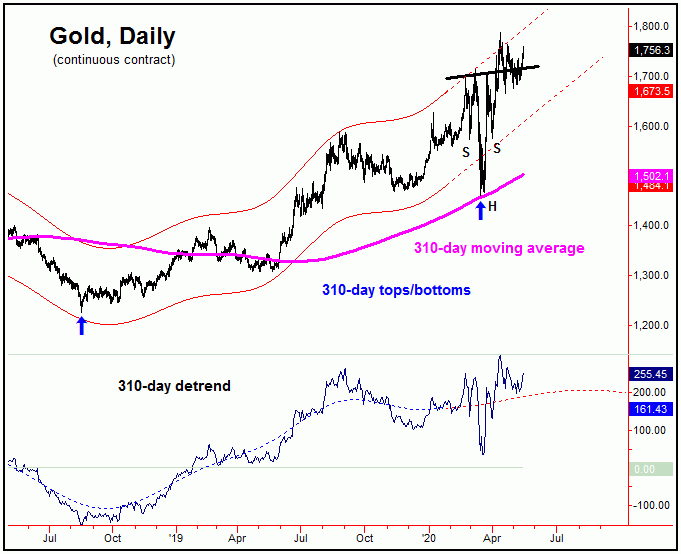
In terms of price, the overall assumption has been that the upward phase of this 310-day cycle will eventually reach up to the 2000 figure or better for gold, before forming the next important peak. This evidence is supported by the inverted 'head & shoulder' pattern that has formed on the daily/weekly price chart. That peak is expected to come later this year, and should be made as a result of the topping of the 310-day and four-year cycles.
U.S. Stock Market Update
From my comments posted last weekend, the recent upward phase of the 45-day cycle was at or into extended territory, and thus was looking for a fairly sharp correction off the top:
From last weekend: "With the smaller 45-day wave now at some 33 trading days along, as noted above it is at or into extended range for a peak. Once this wave does top, a drop back to the 35-day moving average would again be the expectation, in what is favored to be a countertrend affair. In terms of price, our downside ‘reversal point’ for this 45-day wave has now moved up to the 2796.00 SPX CASH figure intraday - and should continue to rise going forward, depending on the action."
With the action seen into last week, we were able to finally confirm the downward phase of this 45-day cycle to be back in force. In terms of time, this wave was projected to bottom out around the mid-May timeframe, plus or minus. Here again is that 45-day cycle, in chart format:
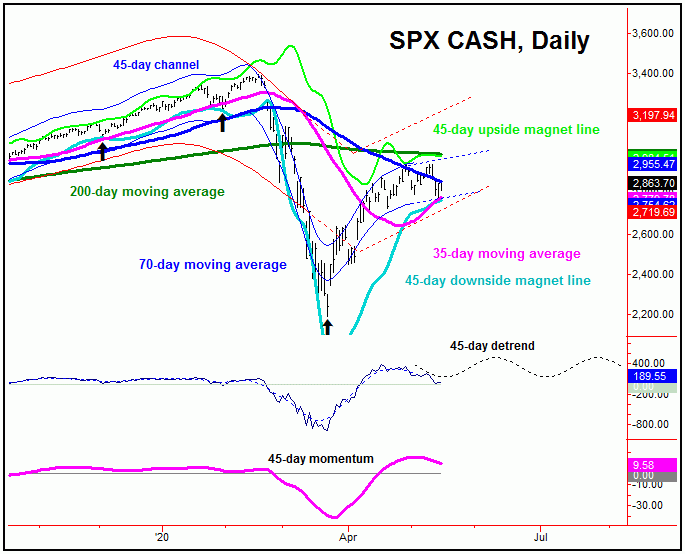
In terms of price, as mentioned in recent articles we were looking for a drop back to the 35-day moving average on the SPX - which was also mentioned as a support level for the expected downward phase of this 45-day cycle. With that, the early-week strength into last week gave way to a sharp decline into Thursday's session - with the SPX coming right down to our 35-day moving average magnet.
With the above said and noted, with the sharp reversal back to the upside off the 2766 swing bottom, there is the potential that our 45-day trough is already set in place - though this has yet to actually be confirmed. However, if correct, then the probabilities will favor additional strength in the coming weeks, where we will be on the lookout for a fairly important peak to play out. That high should come from our next larger wave, the 90-day component, which is shown on the chart below:
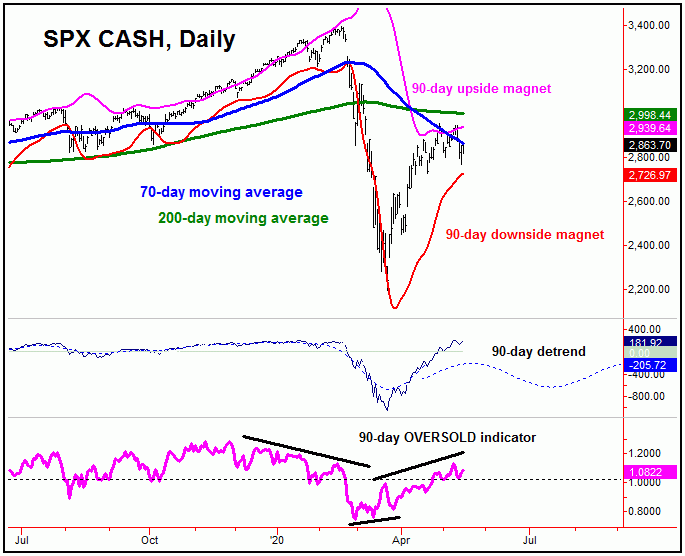
In terms of price, it is too early to suggest what level will top this 90-day wave. However, once it does peak, the probabilities will favor the second largest percentage decline of this year playing out in the months to follow, with more precise details noted in our daily/weekly Market Turns report, which focuses on the U.S. stock market.
Longer-Term View
For the bigger picture for U.S. stocks, we believe that we are still in a larger bear market, one which began back in February of this year - and one that should have more to go in the next year before completing.
Our view is that the decline into the late-March bottom completed an Elliott wave 'A' - of a larger ABC correction into next year, with a wave 'B' (countertrend) corrective move currently in force, one which could take up a lot of time. Once it does complete, however, a drop back to or below the March bottom of 2190.86 SPX CASH is expected to materialize - before bottoming the bear market.
The Bottom Line
The overall bottom line for gold is that additional strength is favored in the coming weeks, though the move could well end up as a labored affair. From there, we will be looking for indications of the next decent swing top forming. As for the U.S. stock market, the ideal path also favors additional strength in the coming weeks, before setting up for a more important peak - which gives way to the second largest percentage decline of this year in the weeks/months to follow. Stay tuned.
Jim Curry
The Gold Wave Trader
http://goldwavetrader.com/
http://cyclewave.homestead.com/


