Key Message For Gold Price Forecast And US Stocks


Last week's trading saw the gold market forming its high in Monday's session, here doing so with the tag of the 1563.10 figure. From there, weakness was seen into Tuesday, where the low for the week was registered at the 1536.40 figure - before bouncing off the same into Friday. For the week overall, the metal managed to eek out a slight net gain.
Gold Holding in Consolidation Mode
For the short-term picture, the last short-term bottom for gold was registered with the 10-day cycle, shown again below:
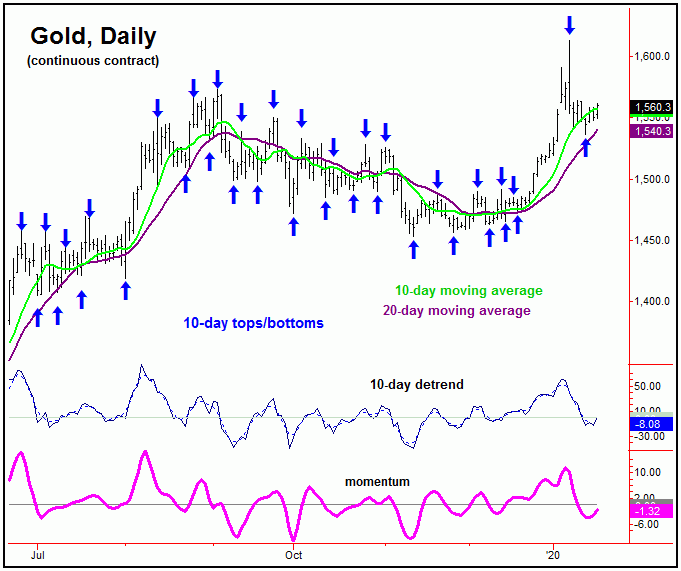
As mentioned in our Gold Wave Trader market report, the last correction phase of the 10-day cycle was expected to see our normal drop back to the 10-day moving average for gold. The action seen into late last week confirms the 1536.40 swing bottom as our last low for this wave, though the latest indications suggest that the upward phase of this cycle is now going to be a limited affair.
In terms of patterns, we expect the current upward phase of this 10-day cycle to end up as a countertrend affair, and with that will be followed by another round of weakness into the late-January to early-February timeframe. We expect this range to mark a semi-important secondary low for gold, with more precise details noted in our thrice-weekly Gold Wave Trader market report.
The Mid-Term View
Stepping back, the next peak of importance is expected to come from the 72-day cycle, with this wave last bottoming on 11/12/19 - which was confirmed with the reversal back above the 1490.00 figure (February, 2020 contract). In terms of time, the upward phase of this wave was originally projected higher into the mid-January timeframe, though our newest indications suggest that it will hold up into the month of February. Here again is our 72-day cycle component:
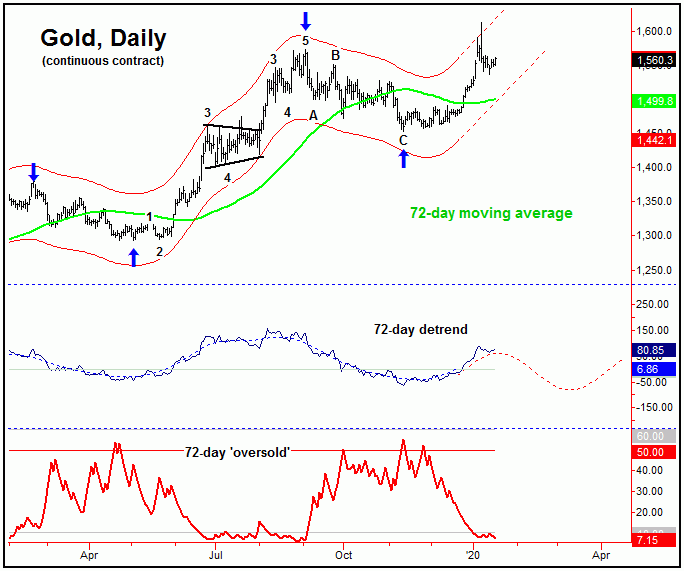
As mentioned in my last article, there is at least some potential that the peak for the larger 72-day cycle was actually made with the recent tag of the 1613.00 figure. Having said that, the more ideal path would favor an aforementioned secondary bottom to be made in the coming weeks, which would set the stage for another push back above that 1613 swing top into February - before actually topping this wave. With that, we are looking for the next good buy side trade to soon develop.
Stepping back, the next peak for the 72-day wave is likely to end up as the price top for the larger 310-day cycle that we track. Once the combination of these waves do top out, gold should see another drop back to or below it's rising 72-day moving average - though with a decline back to the 310-day moving average being more ideal. The latter moving average is currently at the 1491 figure (February, 2020 contract) - though it should be at much higher levels by the time that the next 72/310-day trough forms.
For the bigger picture, we are expecting the next downward phase of the 72-day and 310-day cycles to end up as a larger countertrend affair. If correct, we will be looking for the larger bull trend to continue well into later this year, where we will be on the lookout for technical indications of the next long-term peak to try and form.
The bottom line for gold is that we are looking for the downside consolidation off the 1613 swing top to continue in the coming weeks, then to set up an important secondary low - before making a push back to or above the highs into February. From there, a larger-percentage decline is due to materialize into mid-Spring, once again with more precise details spelled out in our Gold Wave Trader market report.
U.S. Stock Market Update
Back in December, my articles contended that U.S. stocks were in a short-term 'melt-up' phase, with more recent posts suggesting an overextended market - and one that is due for a sharp retracement off the top. In terms of time, we pinpointed the early-to-mid January range as the most likely time for stocks to peak, simply due to statistical factors - as well as seasonal tendencies.
With the above said and noted, we see the downside risk back to the 35-day moving average or lower on the SPX, with that key moving average currently at the 3208 SPX CASH figure (and rising). Having said that, we are expecting any short-term decline phase - if and when seen - to end up as countertrend, due to the configuration of the larger 180 and 360-day cycles that we track. Take a look:
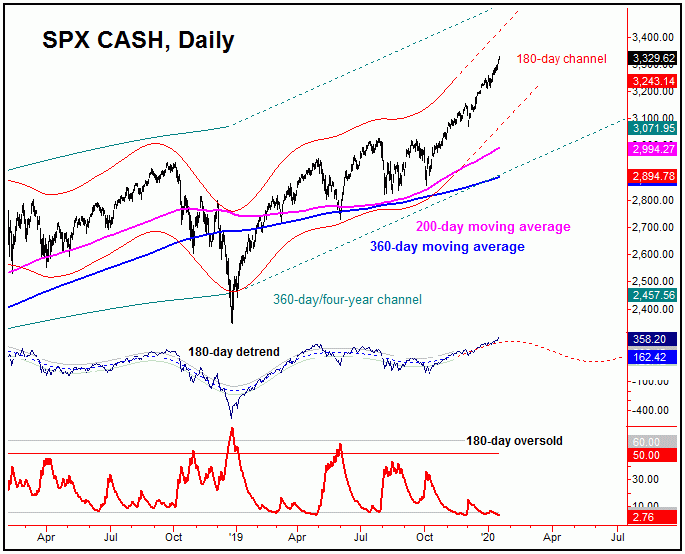
The chart above shows one of the mid-term cycles that we track, the 180-day wave. This cycle last bottomed back in August, which we were quickly able to confirm - and with that has been projected higher into the Spring of this year. Of note with the above chart is that the 200-day moving average is trending upward phase - as well as our 180-day cycle channel. This tells us to expect the next smaller-degree correction phase to end up as countertrend - simply a normal retracement off the top, though it could be fairly sharp, due to the extended nature of this market.
The bottom line with stocks is that a sharp decline can begin at anytime. That decline - if and when seen - is expected to end up as a countertrend affair, inside a much larger bullish trend, which we expect to last into this Spring - before the next mid-term top takes hold. On a side note, we have just released our Market Turns 2020 Forecast issue for the U.S. stock market, which is available via our main website at http://cyclewave.homestead.com/. Best trading on this holiday-shortened week!
Jim Curry
The Gold Wave Trader
http://goldwavetrader.com/
http://cyclewave.homestead.com/


