Key Message for Gold & U.S. Stocks


Last week's trading witnessed Gold spiking higher into Wednesday's session, with the metal pushing all the way up to a peak of 1936.00. From there, however, a sharp decline was seen into Thursday, here dropping down to a low of 1894.20 - before bouncing slightly off the same into the weekly close.
Gold Market, Short-Term
For the near-term picture, as noted in past issues of our Gold Wave Trader report, the upward phase of our most dominant short-term cycle - the 34-day wave - was seen as being in force off the late-September bottom. The chart below shows this cycle:

With the chart above, we can see that the upward phase of this 34-day cycle has been more of a sideways-to-up affair so far, with the wave itself now moving back into topping range - as suggested by the detrend's projected path. It's next trough - if made on schedule - is due around mid-November, plus or minus.
Having said that, the only way to confirm this 34-day wave to have topped would be for a reversal back below the 1876.00 figure (December, 2020 contract) to materialize - a number which could/should continue to move higher in the days ahead, depending on the action.
Going further with the above, more key is the positioning of the larger 72-day channel, which is currently pointing south. Channel resistance will be key around the 1950- 1960 level for Gold, should that range be attempted in the short-term.
Gold's Mid-Term View
For the medium-term picture, as mentioned over the past month or so, we know that the next low of significance for Gold has been due to materialize with the next larger wave, the 72-day cycle, which is shown again on the chart below:
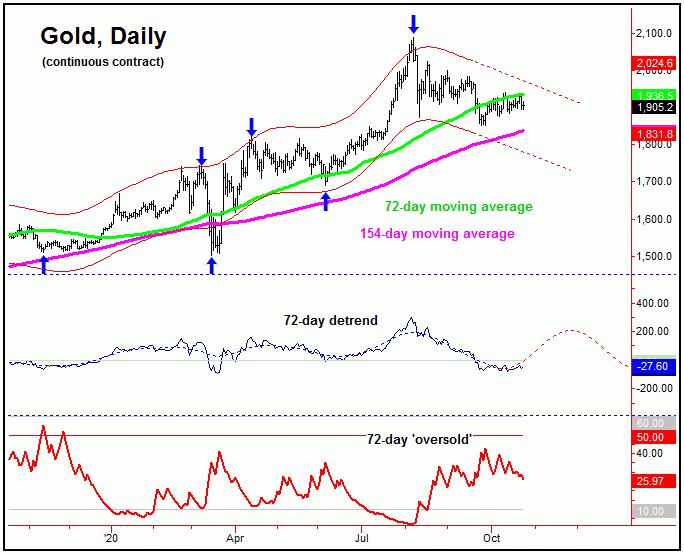
As noted in past articles, our 72-day cycle was originally projected to trough into the late-September region, but does have a good plus or minus variance in either direction. And, though there is some potential that the expected trough for this cycle is already set in place, it is too early to actually confirm.
With the above said and noted, as long as the current upward phase of the 34-day cycle is able to remain below noted channel resistance, then a drop back to or below the 1851.00 swing bottom can still materialize in the coming weeks - with a focus on the mid-November timeframe for this to occur.
Alternately, any firm push above higher 72-day channel resistance - if instead seen - would be our first clue that the larger swing down has bottomed, in which case we would look for only a countertrend decline with the 34-day wave into mid-November.
The Bigger Picture
For the longer-term view, as mentioned many times in past articles we are looking for a push back to new all-time highs in the coming months, with an open upside target from our larger four-year wave to the 2212.00 - 2340.56 region, as shown below:
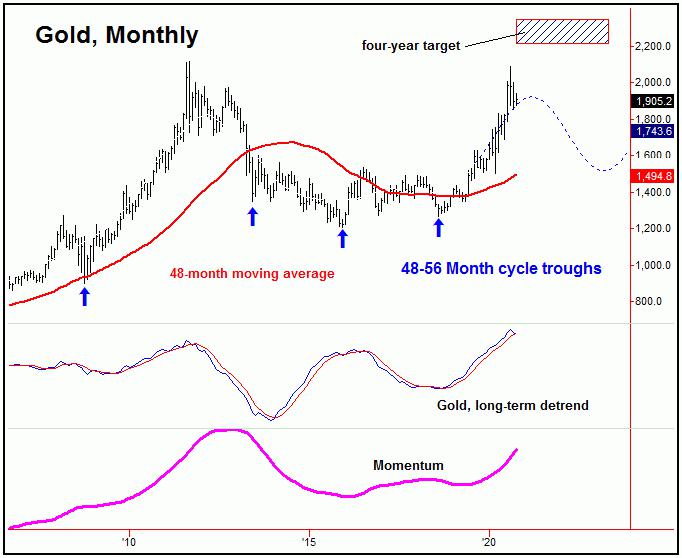
In terms of time, the upward phase of our four-year wave is ideally projected to remain intact into the late-2021 to Spring of 2022 timeframe, with its next trough projected for the year 2023, plus or minus. With the bullish configuration of this wave - as well as the open target to the 2212.00 - 2340.56 region - we have been looking for reasons to buy the recent decline, in the anticipation of higher highs to follow.
Even said, however, it is still too early to say with any degree of confidence that a key low has been seen for Gold, though we will be watching the action closely in the days/weeks ahead for any confirmation of the same.
U.S. Stock Market Update
Back in August we noted that the next decent correction phase would come from our 45-day time cycle in U.S. stocks, which is shown on the chart below:
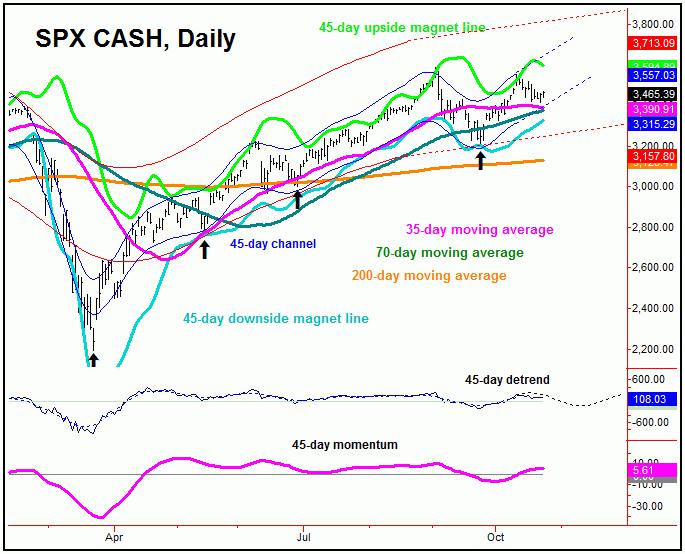
From my 9/13/20 article: "The upward phase of this 45-day cycle was well into extended territory back in early-September, with its peak later confirmed to be set in place at the 3588.11 swing top. In terms of time, this wave is next projected to trough later this month (September), a move which is expected to end up as countertrend - against the upward phasing of the larger-degree 360-day cycle."
As mentioned back in early-September, the correction phase of this 45-day cycle was seen as being in force, with our analysis looking for a drop back to the 70-day moving average - with that same moving average also acting as support to that decline (plus or minus). This did play out as expected, with the patterns favoring that correction to end up as a countertrend affair - within a larger uptrend, coming from our 360-day wave, which is shown on the next chart:
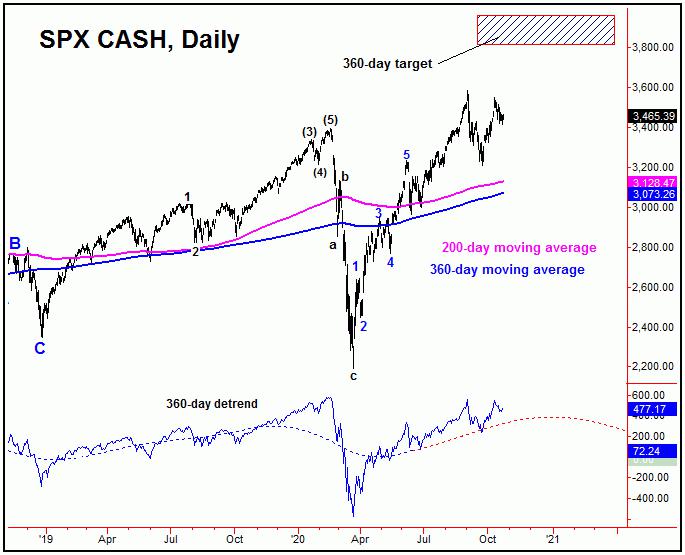
On the chart above we can see that our 360-day cycle is projected to remain higher in the coming months, ideally well into early-2021 - before working on the next mid-term peak for U.S. stocks. In terms of price, there is an open upside target for this wave to the 3812.56 - 3960.44 SPX CASH region, which we expect to be met at some point between now and the Spring of next year.
Going further with the above, with the configuration of this 360-day cycle, the overall assumption was that the recent correction phase of the smaller 45-day wave would end up as countertrend, as it did manage to do. If correct, then the upward phase of the smaller cycle should see some additional short-term strength, before turning back to another correction into the mid-November timeframe, plus or minus - a move which would also be favored to end up as countertrend, before giving way to higher highs again into later this year.
The Bottom Line
The overall bottom line for Gold is that there is the potential that the metal saw a key low registered back in late-September, though this has yet to actually be confirmed. Either way, the overall outlook for the metal calls for an eventual push back to new all-time highs in the coming months. As for U.S. stocks, the larger uptrend is projected to remain intact well into next year, though with the normal up-and-down gyrations along the way - the next of these due to materialize in November, though with each favored to end up as counter moves, to the bigger upward phase.
Jim Curry
The Gold Wave Trader
http://goldwavetrader.com/
http://cyclewave.homestead.com/


