Late May Market Update


I'm happy to say that this week Barron's magazine published an article I wrote on Electrical Power Consumption. You may want to buy an issue to check it out. Now down to business.
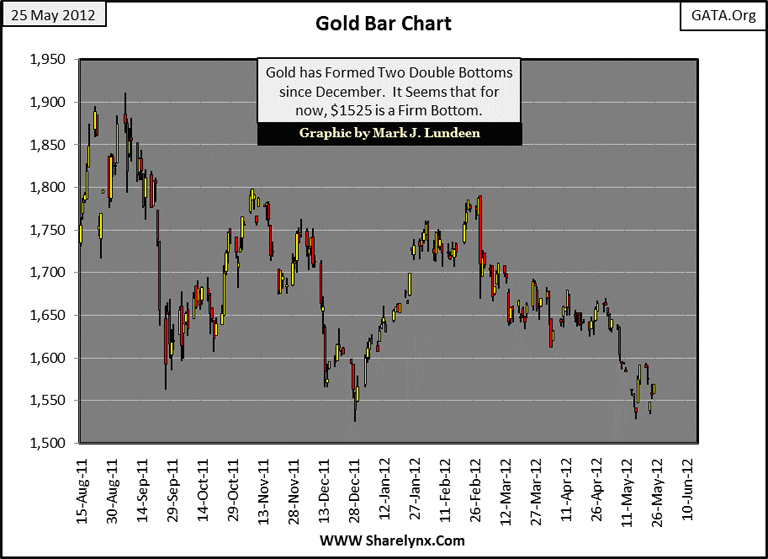
Gold has formed two double bottoms in the chart below:
- The lows of last December were breached, two weeks ago, but just barely.
- And then after a run at $1600 once again this week, gold attempted to break below the lows of two weeks ago, and failed.
Currently, $1525 gold seems a solid bottom, but technical analysis is difficult when the "policy makers" are naturally opposed to a trend, such as gold and silver appreciating in value. Why would that be? Because they don't want competition from gold and silver; they want investment funds to stay where they are, in paper assets controlled by them. They don't want any competition for their unbacked currency whose purchasing power is constantly being diluted through overprinting. Allowing the old monetary metals to appreciate to free market prices would highlight the fact that their paper dollars and base metal coins have been a complete and total failure as a store of value for people's savings. An old junk-grade silver dollar now goes for over 25 paper dollars. But in 2012, after decades of manipulating market prices with considerable success, the politicians, social scientists and bankers are now having problems controlling the market's valuation parameters.
Europe is a mess. The smartest people in the world (Keynesians socialists) created the European Union, and then in only a decade they ran it into the ground. That is quite an achievement. If I had control over Europe's economic system, I'd have done something completely different, like letting banks fail and force all national governments who spend many multiples more than they take in taxes to default on their debt. In my opinion, bond buyers who purchased Greek debt at 5%, or US Treasury long term bonds for less than 3% deserve what's they are going to get.
There isn't a single economic benefit to society, except for the few, pretending trillions of dollars in bad debts, like abandoned mortgages, are viable assets. But the only solution to Europe's financial system current insolvency problem the smartest people in the world can think of is keeping bad debt on the books, pretending they are viable assets, and enforce "austerity" measures; a euphemism for squeezing the little guy to keep the well connected, well connected.
"Austerity has failed. You won't see that in any of the headlines from the media propaganda machine, and for a very good reason: our intellectually bankrupt governments have no "Plan B"." - Jeff Nielson of bullionbullscanada.com
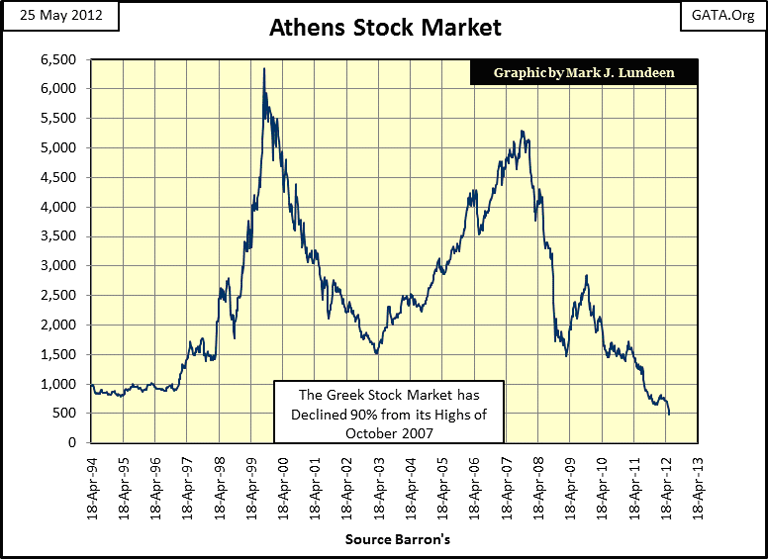
Jeff Nielson has it exactly right. The masters of Europe, and America, keep their financial empires afloat with ever more "injections of liquidly" because they don't know what else to do if they are to survive the coming storm. So what possible solution is not being considered? The liquidation of illiquid debt! Force all banks, including central banks, insurance companies and pension funds to finance their daily operations as they used too, in a free market, devoid of price fixing by Doctor Bernanke and his ilk. It would be horrible, but the fact is that it's already horrible. Look at the Greek Stock Market; after years of attempting to save the Greeks with Plan A, the smartest people in the world have failed. From its highs of October 2007, the Athens stock market has declined 90% and there are now riots in the streets. If you were a Greek investor, I know that by now you finally see the error of having stayed in the stock market since 2000, instead of buying gold and silver. But it's not too late for Americans.
Maintaining the fiction of "price stability" (Plan A) using monetary inflation to preserve make-pretend valuations in the global debt and equity markets is only making the problem worse. But they refuse to consider Plan B, as they knowthat central to the operation of Plan B is allowing the free markets to fix financial asset prices. What do they say to the media when the $15.7 trillion dollar face value of the US Treasury Market plummets to $500 billion? This is exactly what could happen when T-bond yields approach their 1981, 14% levels. So, global authorities are well motivated to keep the lid on the price of gold and silver (by flooding the paper futures markets with insincere promises to deliver more metal than can possibly be produced) to prevent this from happening today, next month, or next year.
And for this reason I really can't become a raging bull on gold and silver - just yet. The Fed, BIS, and ECB, and the politicians they control in Europe and North America are not just going to go down without a fight when their financial systems begin to deflate. So I'm still expecting lower precious metals prices sometime in the near future, as Europe's banks begin to have big problems.
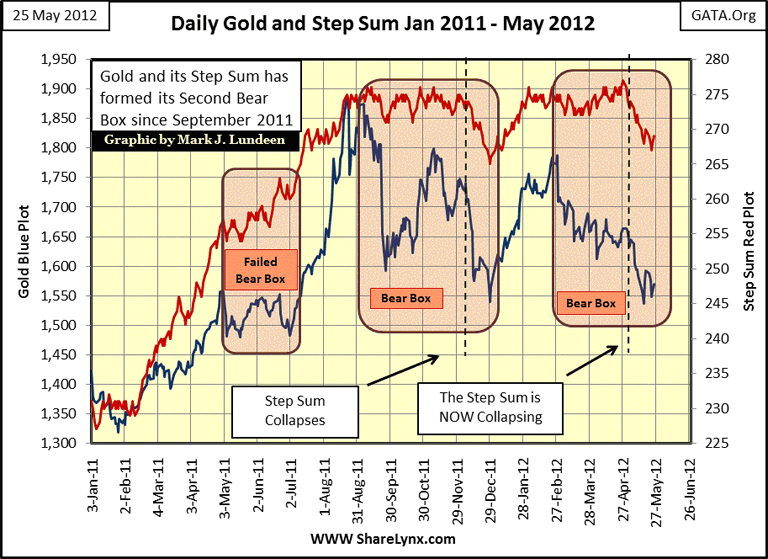
It's time to get off my soap box and take a look at the markets for last week. Taking a look at gold and its step sum, it still looks like we might see lower prices this summer. What would it take for me to change my opinion? Higher gold prices and a clear reversal in the two trends below; and we are not there yet.
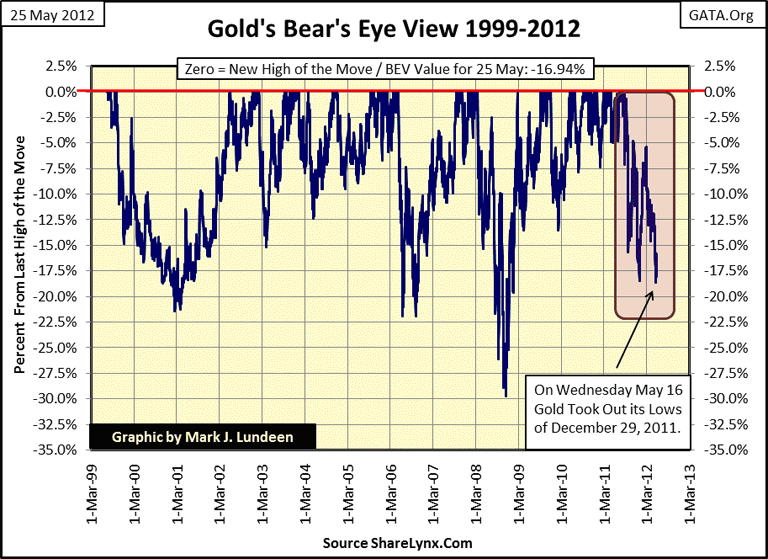
This next chart is more comforting: since 1999, our current correction in gold is still in a distant 4th place. For all the negative press gold has had, it's only down 17% from last August's all-time highs. Considering the coming, and unavoidable problems in Europe (and then in the US's financial systems), I'd have thought the "policy makers" would've made the effort to make the post August 2011 decline at least the #2 decline since 1999. Maybe I'm wrong; it could be that this double bottom marks the beginning of the next advance towards new all-time highs in gold. Are you confused my indecisive opinion of the future? Well I can't say exactly what is going to happen in the short term, but long term I'm still very bullish!
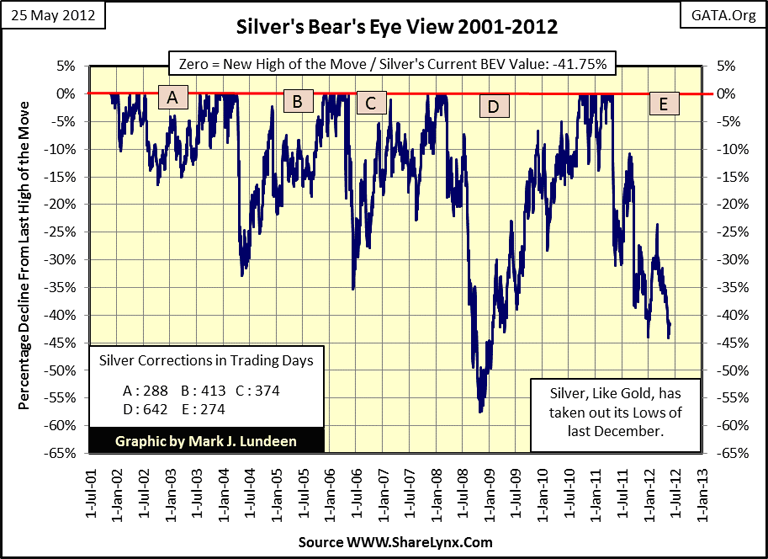
Let's now move on to silver. Silver's current correction is the second deepest since 2001, but like gold, twice the bears tried, and twice failed to take it to new lows. That's good! Also, look at the letters in squares marking silver's corrections, and the table in the chart listing the duration of those corrections. The fact is that since 2001, every time silver got whacked, it's taken a lot longer than the current 274 trading days before it has gone on to new all-time highs. And every time it has, silver has made the wait worthwhile for investors, much more so than gold with its smaller corrections of 20%.
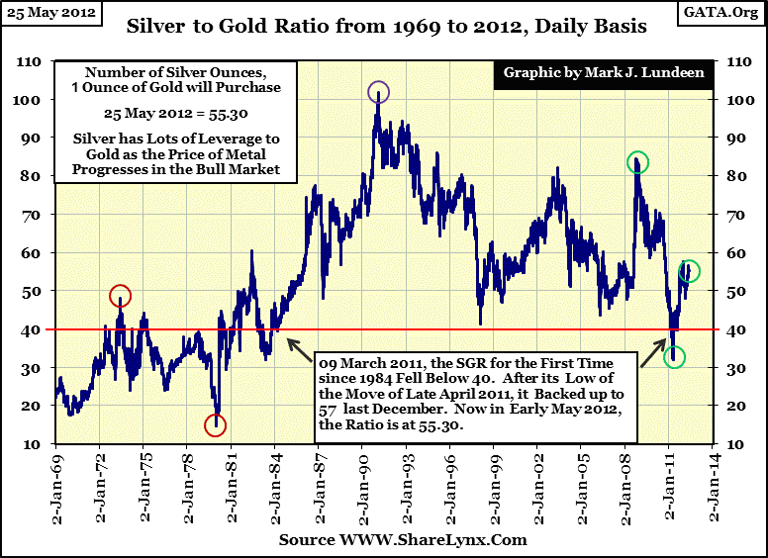
Now we go on to the Silver/Gold Ratio. Everyone else calls this the Gold/Silver Ratio, but that is just poor English and a mathematical misrepresentation of what the plot is displaying: the number of ounces of silver that one ounce of gold can purchase. So, in my articles it's the Silver to Gold Ratio, and is going to stay that way.
This chart is important as it shows the leverage silver provides investors in precious metal bull markets - a lot, depending on when you buy silver. At the close of trading this week, one ounce of gold purchased 55.30 ounces of silver, more silver coins than will fit into the pockets of your blue jeans. But back in early 1981, when gold and silver saw a panic top in their price, an ounce of gold purchased only 16 ounces of silver. Silver purchased today, unlike in 1981 has significant upward leverage relative to the price of gold.
Is this reversion to the mean going to happen again as governments and their central banks continue to destroy the world's paper money standard? My money is on it. In fact I think the ratio will go single digit before this bull market in precious metals is over, because since 1981, billions of ounces of silver have been consumed, and tossed into landfills across the globe. Silver solder, used in plumbing and refrigeration for many decades to connect copper tubing, is melted down with the recycled copper, and lost forever. And this is just one of the many industrial and commercial applications for silver in which after the service life of the manufactured unit that contains silver is finished; its silver is not recycled and so forever lost to the market. In the past decades, silver by the billions of ounces have been lost forever, making above ground gold inventories more plentiful than silver.
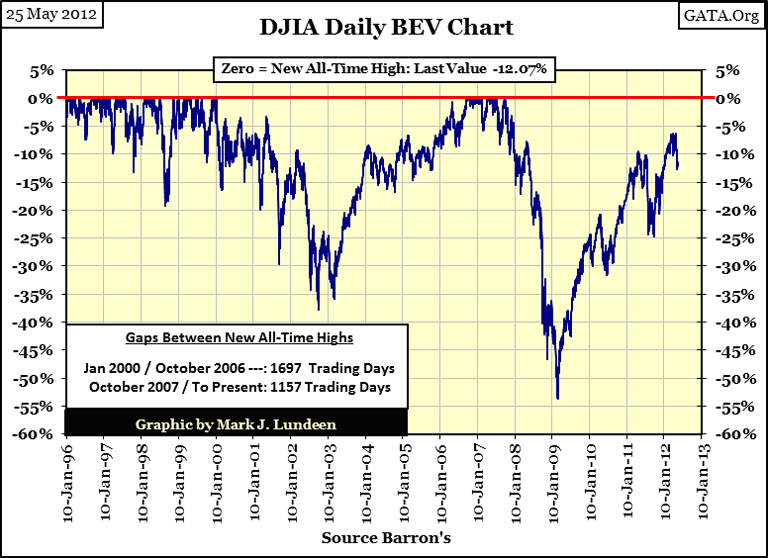
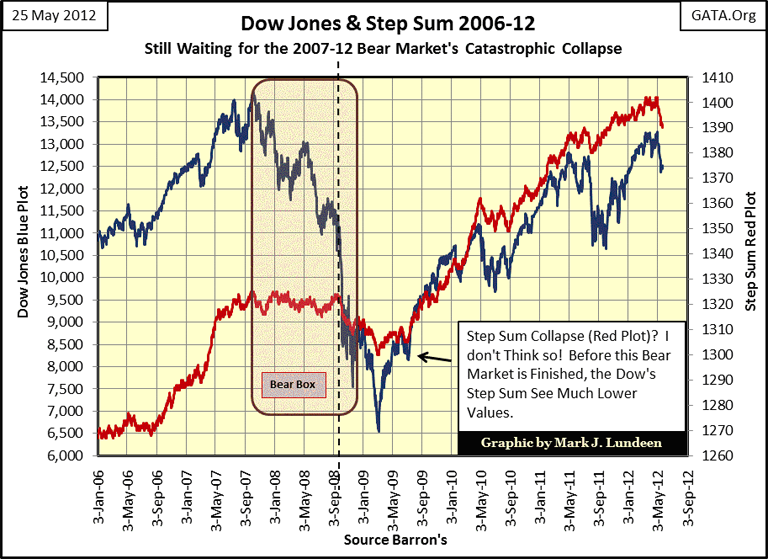
So what has the Dow Jones been doing? Since the beginning of May, it's been going the wrong way. But that seems to be the continuing trend since the high-tech top of January of 2000. In the BEV chart below, look at the cluster of frequent new all-time highs in the Dow Jones investors enjoyed from 1996 to 2000. That's what a bull market looks like, lots of new all-time highs. Since 2000, that's not what we've seen the Dow doing for investors. The stock market right now is just a waste of time, with the significant potential of massive losses. Ask the Greeks about that. Am I saying the Dow Jones could decline by 90%? Well I've said that many times before; but this time I'll just say that if the US Government stopped supporting the American stock and bond markets for just two months, going cold turkey on the "liquidity injections", we would all find out real fast if I was right or wrong.
There has been a pattern change in the NYSE 52Wk H-L Ratio. For months, whether the Dow Jones Closed up or down, daily there were always more 52Wk Highs than Lows. But since May 7th, the ratio has been negative for all but three trading days. The Dow Jones is feeling the effects of all these new 52Wk Lows at the NYSE; since May 1st it's down by 825 points.
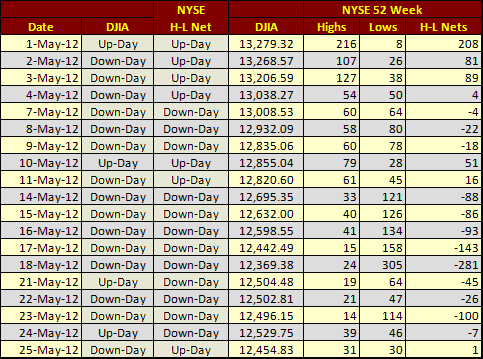
And look at all the DOWN DAYS the Dow Jones itself has seen since May 1st. That's not good for you stock bulls out there! What does the immediate future of the Dow and its step sum look like? Bearish! I do believe that before this is all over, we are going to see another Dow Jones decline on the order of the Great Depression, that will produce a steep decline in the step sum of over 100 points: yep! So far it is down 12 net days since April 27. But it's too soon to tell if it's 12 steps down, with 88 more to go.
I haven't shown the next chart for a while; it's the number of new all-time highs the Dow Jones Total Market Groups have made each week since January 1992. We can see how easily "liquidity" flowed into the stock market when Alan Greenspan was at the Fed. No wonder everyone, but a few hard-core gold bugs, like me, loved the guy. But then, after the 1997 top, the stock market developed a "liquidity" leak that the plumbers at the Federal Reserve and government regulators still haven't figured out how to plug.
The next surge peaked in 2005, about a year before Greenspan departed, and Bernanke became Chairman of the Fed. The Dow Jones and S&P 500 may have gone on to new all-time highs in 2007, but the chart below tells us that it was getting lonely at the top.
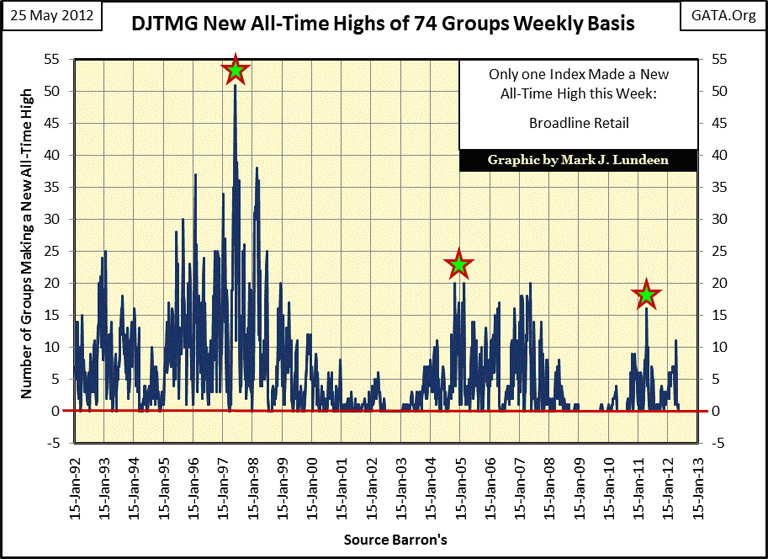
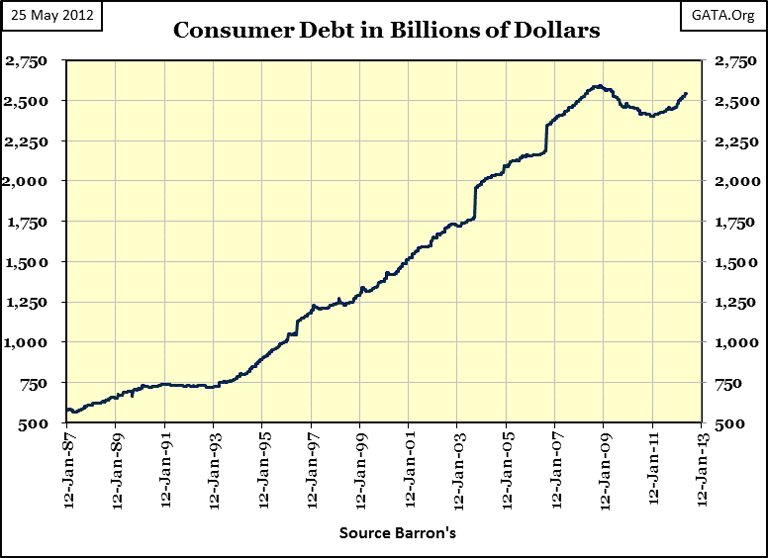
And then this week, as broadline retailers reached a new all-time high, it had absolutely no one else to enjoy the view with. These retailer's stocks won't stay at the top for long, either for reasons of loneliness, or these merchants' customers finally max out their credit cards.
At the close of the trading week I can find nothing positive to say about the stock market, but there are reasons to be hopeful for a rebound in gold and silver, if you can put aside my concerns of massive downward price manipulation should Europe's banks begin to melt down. As for the stock market, since 2000 it's been a bad habit for the millions of people who find comfort in taking free advice from TV experts. CNBC is so despicable. Unfortunately, the history of the stock market is a frequently repeated story of the little people who didn't know when to call it quits on the last bull market, and are afraid to jump in early in the cycle for the next bull market. It's a tragedy, but such is life.
Monday is Memorial Day, a day to remember all the young people who never came home to their family and friends. Take a moment on Monday to think of these young Amen and women who stood up for our country and paid the ultimate price. GOD BLESS THEM.
Mark J. Lundeen
[email protected]
[email protected]


