Lies, Damned Lies And…


It is a well-known fact that the view individuals have of the world around them is very much coloured by a filter that operates between their eye and their brains. The filter is the combination of their preferences and prejudices regarding the state of the world in which they live. People mostly ‘see’ what they want to see and are blind to whatever does not match their personal preconceptions. This is not something new; it probably goes back to a time our ancestors lived in caves. Today, though, differences between one reality and another have become institutionalised and widespread.
Different realities? Marshall McLuhan, communications guru of the 1970s, famously said that “The world is as it is reported.” This implies that a report on aspects of the state of the world has to be considered with knowledge of the likes and dislikes of its author. Most people do this when the subject is a matter of politics or relationships between different opposing groups or countries. We all have our biases and are mostly content with them – that is, in those cases where we are not oblivious of the fact that we all do have personal biases that are not written in stone for all people.
Most reasonable people accept their biases and recognise those of others on a premise that people are different in their preconceptions and beliefs. However, they would, as a rule, believe that hard facts must cut through personal subjective views to present an objective view of reality. Unfortunately, it far too often happens to be hard facts that get reported in such a way that they slant the true state of affairs in one way or the other. Then one’s view of the world gets distorted away from reality by the biases of the source of one’s information.
Listening to reports from CNN or from Fox News or RT, or watching what is telecast on YouTube or BitChute or one of the many other channels, brings home different views of what is happening in the United States of America. Very different. It is understood that the opinions of talking heads will vary according to the source, but many people have a too naive perspective on the world. Anything sounding scientific or technical stated by someone supposedly politically neutral and which is conveyed with factual evidence to support the statement, is accepted at face value and not subjected to a common sense test. As if hard facts quoted by an ‘expert’ will ensure making their world go round smoothly as before without wobbling.
Not so in real life. Mark Twain said, also famously, “There are lies, damned lies and statistics.” Below are some statistics regarding the US labour situation from ‘reliable’ sources that were announced during the past week.
U.S. businesses shed 301,000 jobs in January, ADP says, in biggest drop since start of pandemic Feb. 2, 2022 at 8:22 a.m. ET MarketWatch
Omicron kept people out of work and delayed hiring plans early in the new year. The numbers: Privately run U.S. businesses reduced employment by 301,000 jobs in January –- the biggest drop since the start of the pandemic— as a record omicron wave kept people out of work and delayed hiring plans. Economists surveyed by The Wall Street Journal had forecast a 200,000 gain. The decline was the first in 13 months and the largest since April 2020, when the U.S. lost almost 20 million jobs during an economic lockdown in the early stages of the pandemic.
The last few days of January and then into February saw 238 000 job losses, to result in initial claims against unemployment insurance. This excludes the estimated 16% of workers without that benefit. In the 3rd week of January it was 261 000, “after a spike in early January.” So let us assume the first two weeks had a total 500 000 job losses. That amounts to almost 1 million workers being laid-off during January. Wow!
Then the next day this was announced.
U.S. unemployment claims drop 23,000 to 238,000 as omicron wave relents
Feb. 3, 2022 at 8:33 a.m. ET MarketWatch
Coronavirus had caused a spike in jobless claims in early January.
The numbers: New requests for U.S. unemployment benefits fell for the second week in a row to 238,000, as the record omicron wave receded and more people were able to go back to work. Initial jobless claims declined by 23,000 from a revised 261,000 in the prior week, the Labor Department said Thursday.
Do the above two reports in combination imply that perhaps up to 700 000 workers have falsely claimed unemployment compensation? Or did nearly 700 000 workers immediately find other employment after losing their jobs. One cannot know from the above. But stranger is yet to come! The BLS announced on Friday:
U.S. gains 467,000 jobs in January and hiring was much stronger at end of 2021 despite omicron
So, if all the above is believed to be true and valid numbers that describe the reality that is the US economy, losing close on a million jobs in January – where the claims from unemployment probably include the 300k that ADP reported – must have been off-set by going on one and a half million new hires. Yet the BLS table of employee changes in the different sectors of the economy shows nothing of the sort. In fact, by looking at the sector numbers, the US economy is heading for major trouble!
The bulk of the newly created jobs were in the service sector: 440k of the 467k jobs (94%). The BLS table also tells us goods producing workers increased by 4 000 and manufacturing gained 13 000. Most of the 467 000 people in the new jobs – excluding the 16 400 new workers in education and health services – are ‘doing things’ which, except for spending their income, add nothing of significant material value to the US economy. We all know by now that simply shifting paper and goods around adds to the GDP, but does not actually boost the real economy; one only has to look at China for the opposite effect on an economy when many workers actually are engaged in ‘making things’, not only ‘doing things’!
On Thursday the news that the number of newly unemployed was 23 000 fewer than the week before was not positive enough to change the bearish pressure on Wall Street and the DJIA dropped by 1.45%. Friday’s surprisingly good nonfarm number after the less promising labour numbers earlier the week boosted the stock market for most of the day to recover from a poor start to trading. In today’s climate, one really has to wonder whether it was a case of “Mission accomplished”?
The BLS reports that there are four thousand new US workers in manufacturing! One can only wonder how many Chinese workers have started to work in manufacturing jobs since the new year. This is not the place to look into why and how the US became a welfare state since its heydays during the 1970s, but it is evident the trend to “do” rather than “make” has become steeper for a long time and shows no sign of ending.
The statistic in the BLS tables states that 99 million people of working age are in the labour pool, but do not have a job. This obviously includes a good number of housewives and students and others who are not able to hold a job.
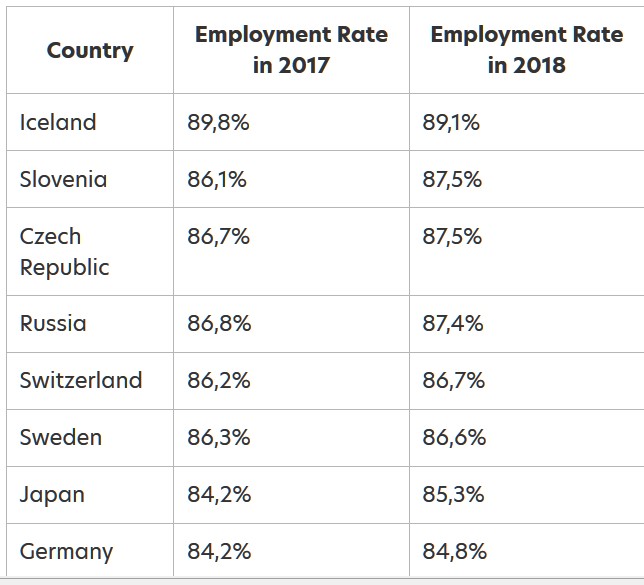
More pertinently, the table on the left shows a comparison of the percentage of people from 25 to 54 years of age – prime employment years – for the top ten countries. The FRED data base has the employment rate for this age group at the end of 2018 at 79.6% - not really in contention with these countries, including the quite socialist Sweden. The US falls outside the top ten by almost as wide a margin as that which separates the first and last countries in the table. One can only wonder what percentage of workers in the different countries and the US is in manufacturing and other material wealth creating sectors.
One can of course only assume that these numbers adequately reflect the reality we all are living in!
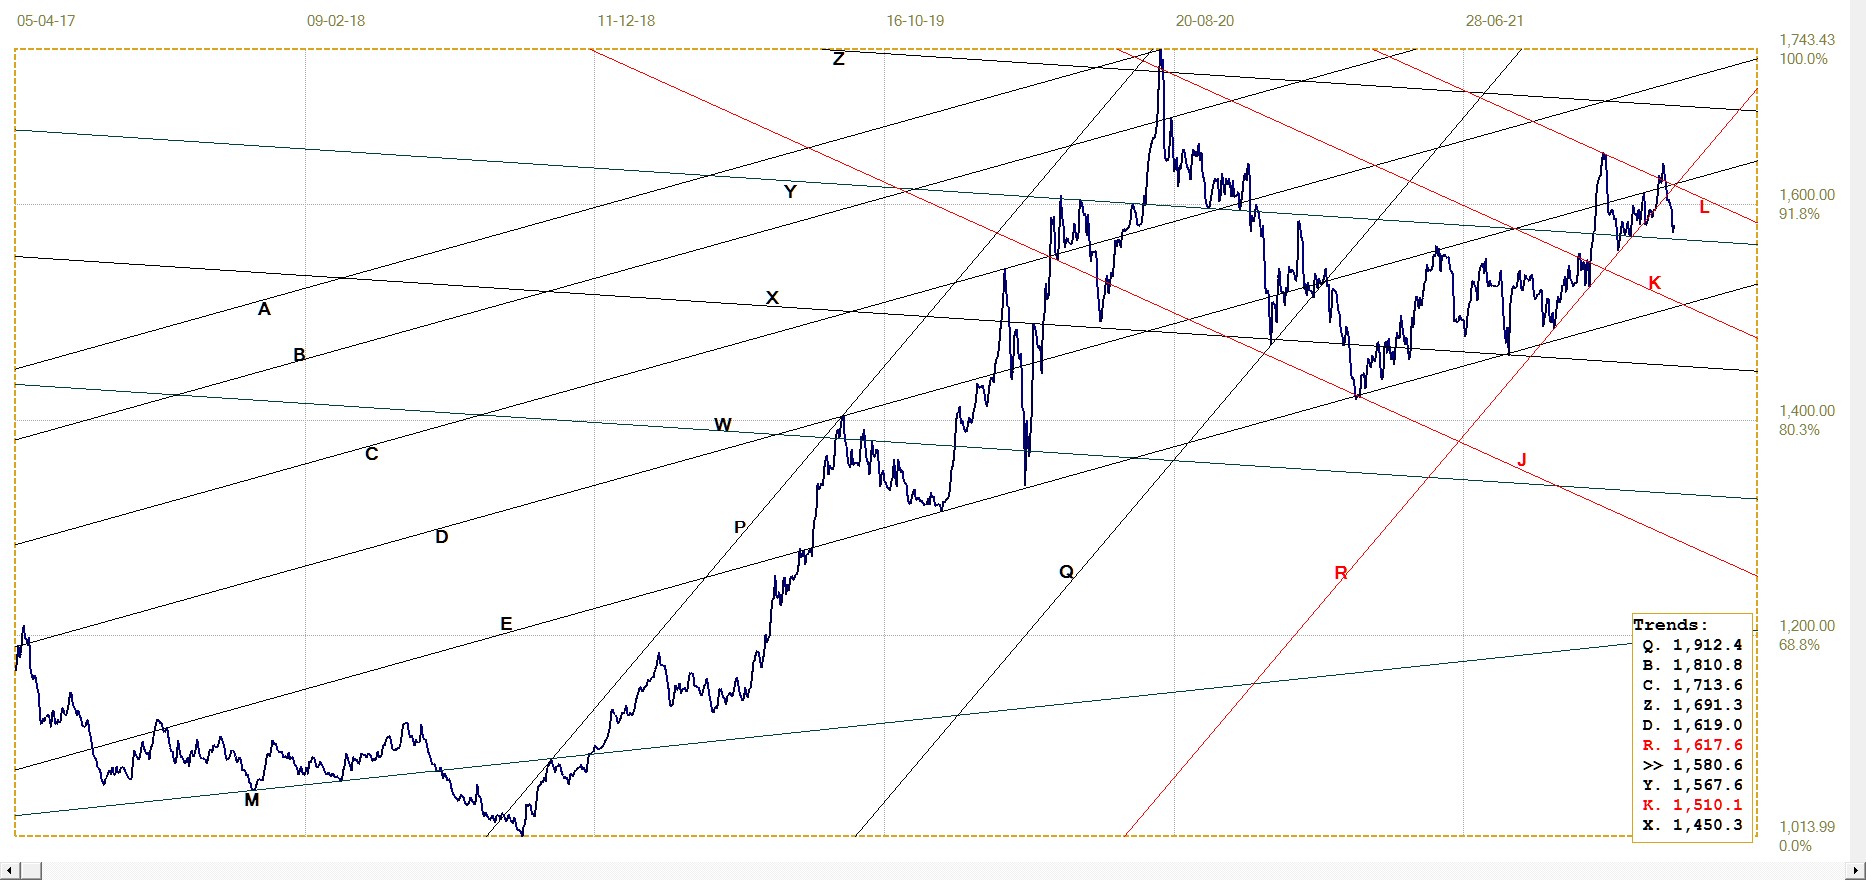
Euro–Dollar
The previous week up to 10 days ago, the euro suffered a sudden blitz that broke below its bull channel KL and sent it steeply lower to test support at line E, the bottom boundary of its less steep long term bull channel. The stronger dollar helped support Wall Street that was experiencing strong selling pressure. A definite break below the broad channel would have been bad news for the euro, but luckily the support held and the euro is now back in channel KL. Now to see if the break higher can hold.
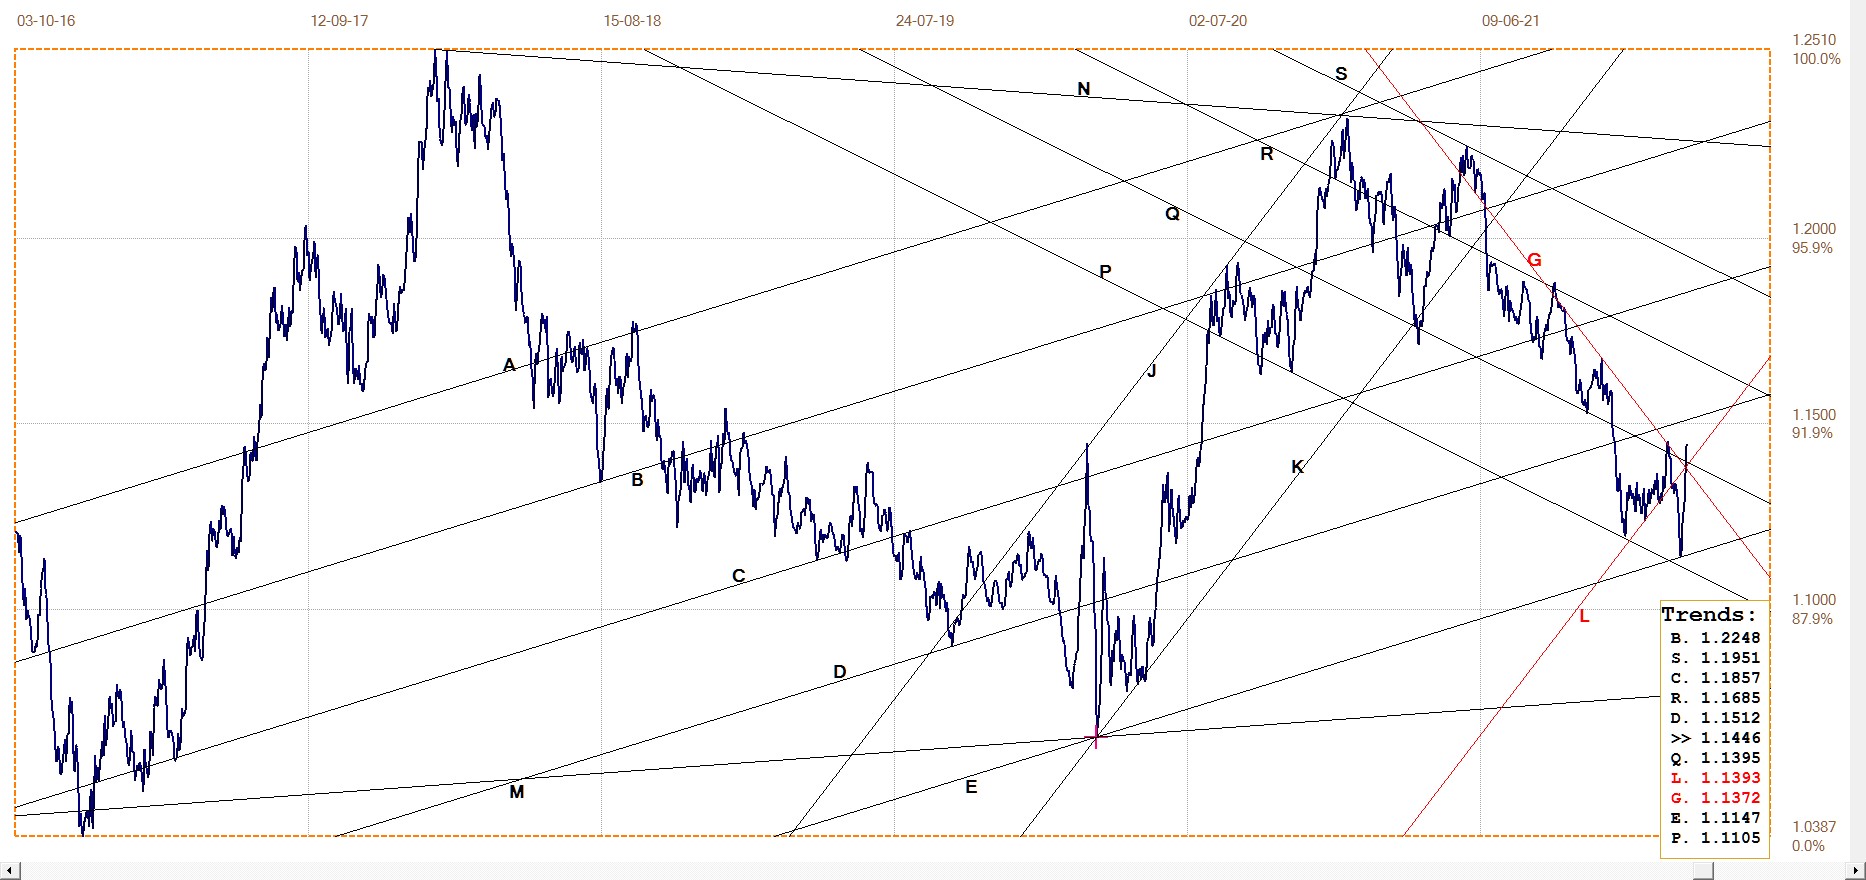
Euro–dollar, last = $1.1446 (www.investing.com)
DJIA daily close
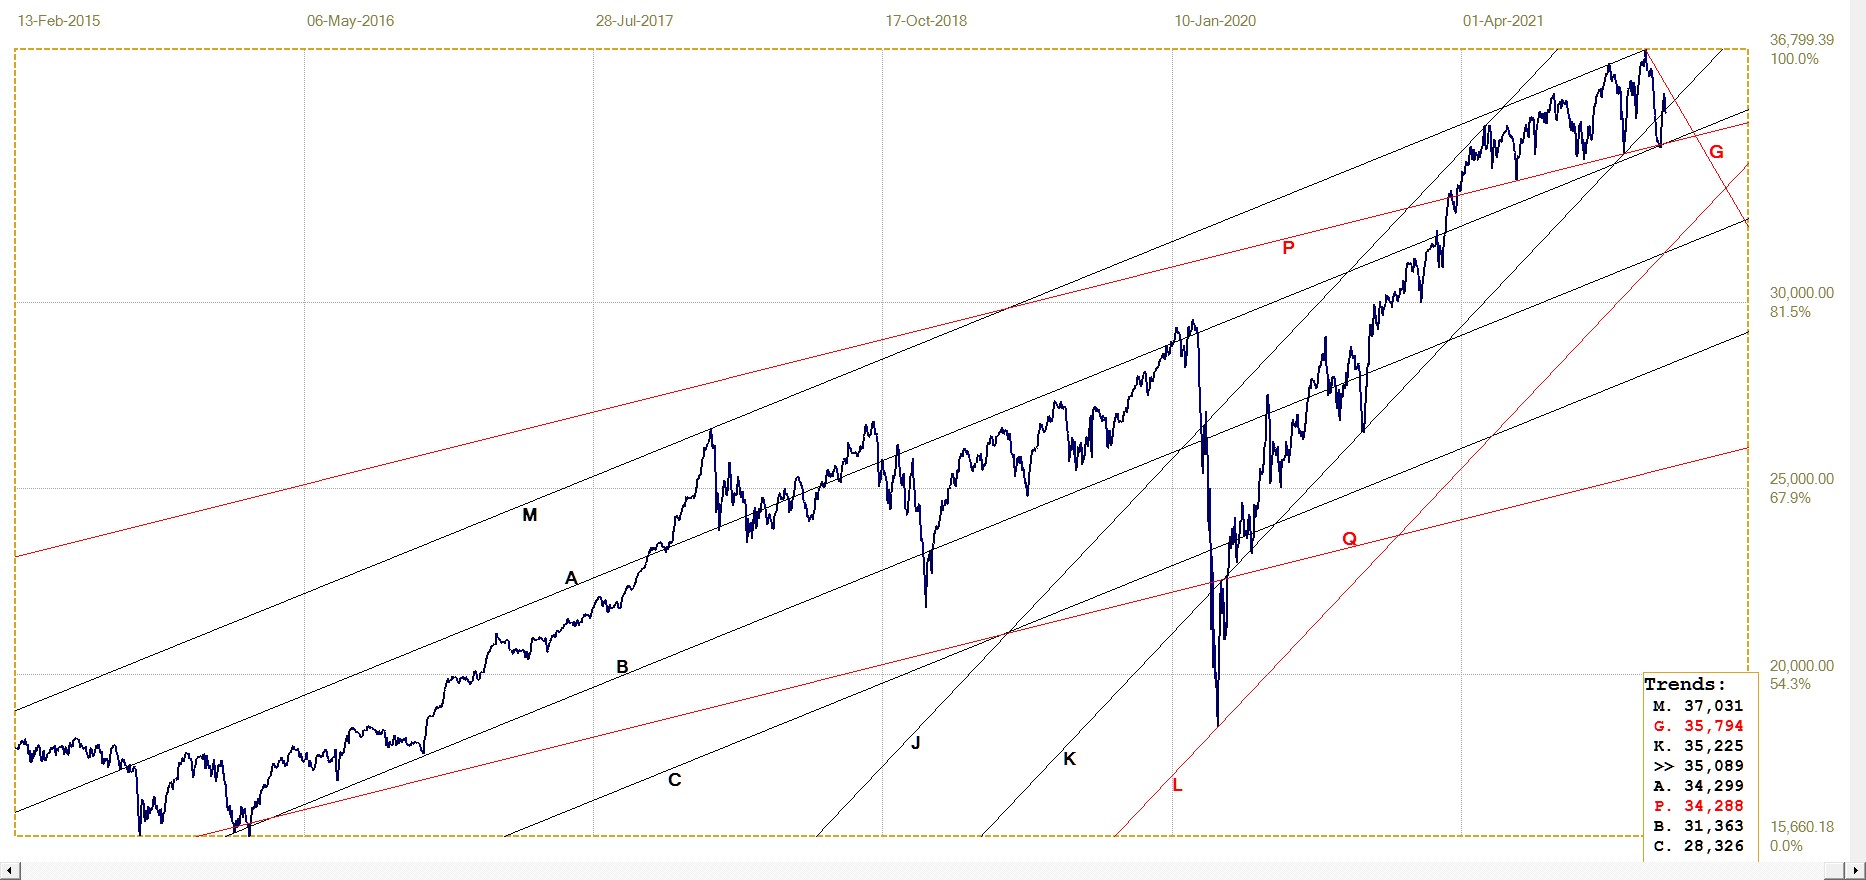
DJIA last = 35089.15 (money.cnn.com)
Wall Street is still behaving as Wall Street does – the futures markets either begin the trading day in the east with a rally and then US trading opens with a wild rush to add further gains to the futures. Soon after, the market has to defend against the Bears. Alternatively, the futures remain quiet during most of the day with relatively little changes to the futures prices, in which case the stock market is sold off on the open. Soon, however, the sell-off then ends on high volume and a day long battle ensues to trigger the Bears’ stops so that their retail buying assists the recovery.
On Thursday, with rather glum labour related news about the state of the economy, the early sell-off could not be reversed and at best the rate of decline was limited to a loss of 518 points for the DJIA. On Friday, the sellers tested the market early on and soon had the DJIA down by 300 points. The usual attack was then launched and later in the day this had the DJIA higher off its early low by 500 points. This rally could not be sustained and the market was marginally lower on the day at the close.
It is doubtful whether the strong nonfarm number? will carry through into a bullish bias for equities this new week. The powers that be helping to support the stock market are expected to have their work cut out for them.
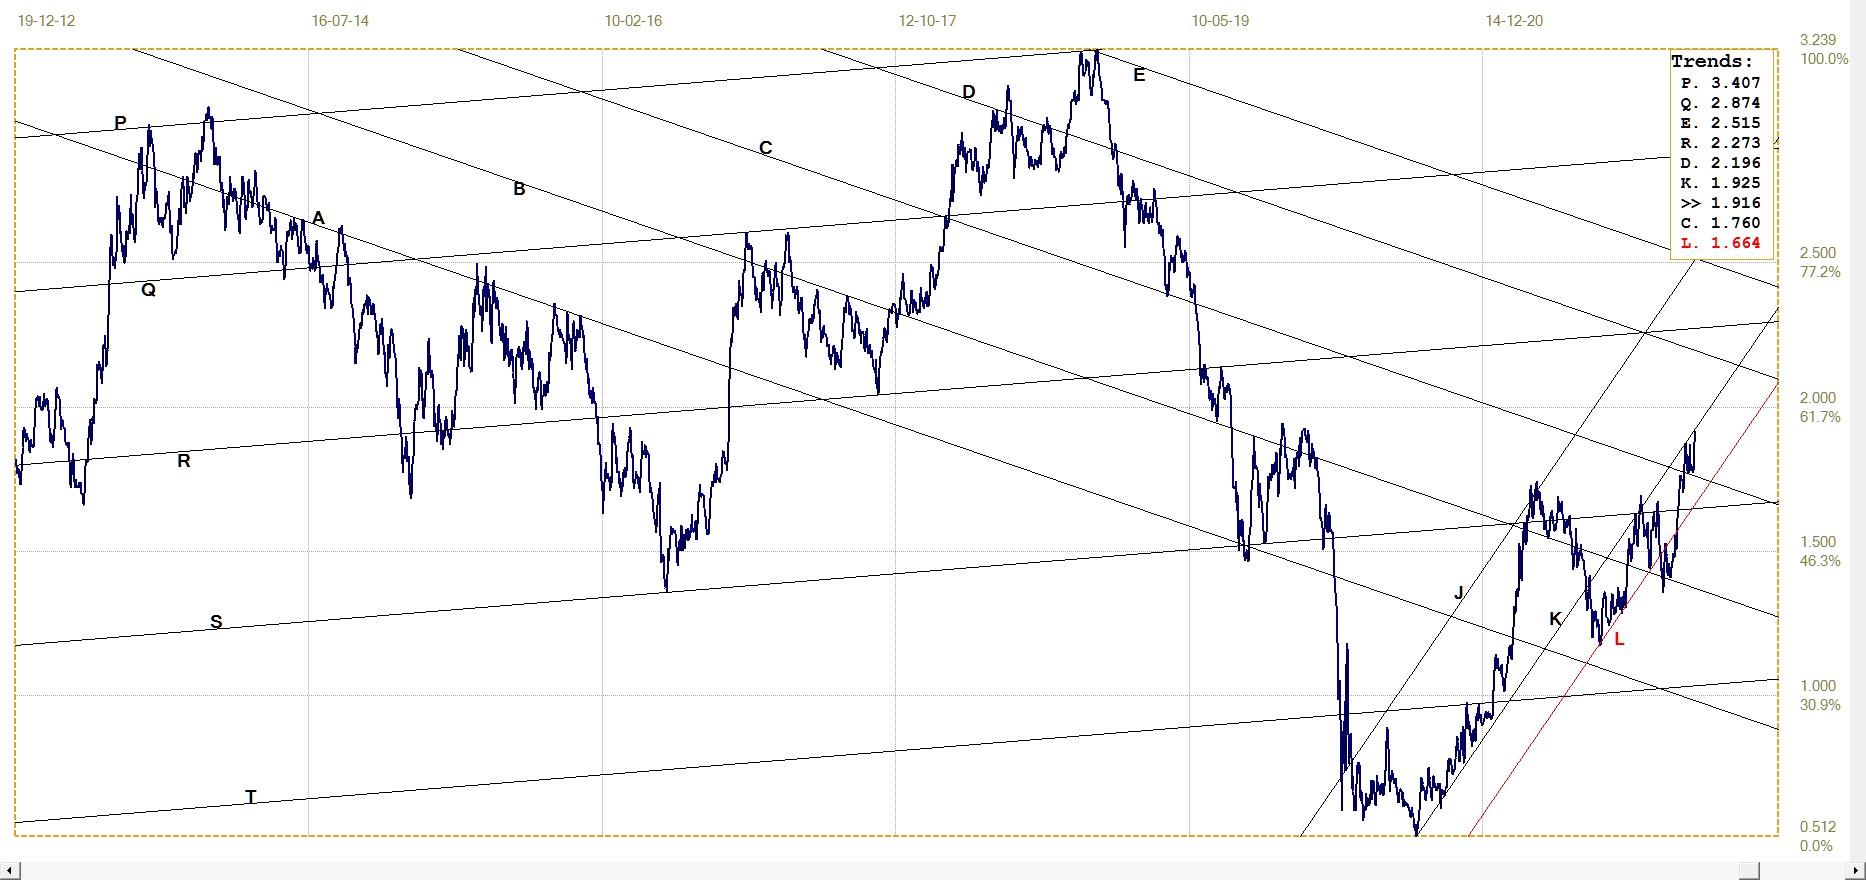
Gold London PM fix – Dollars
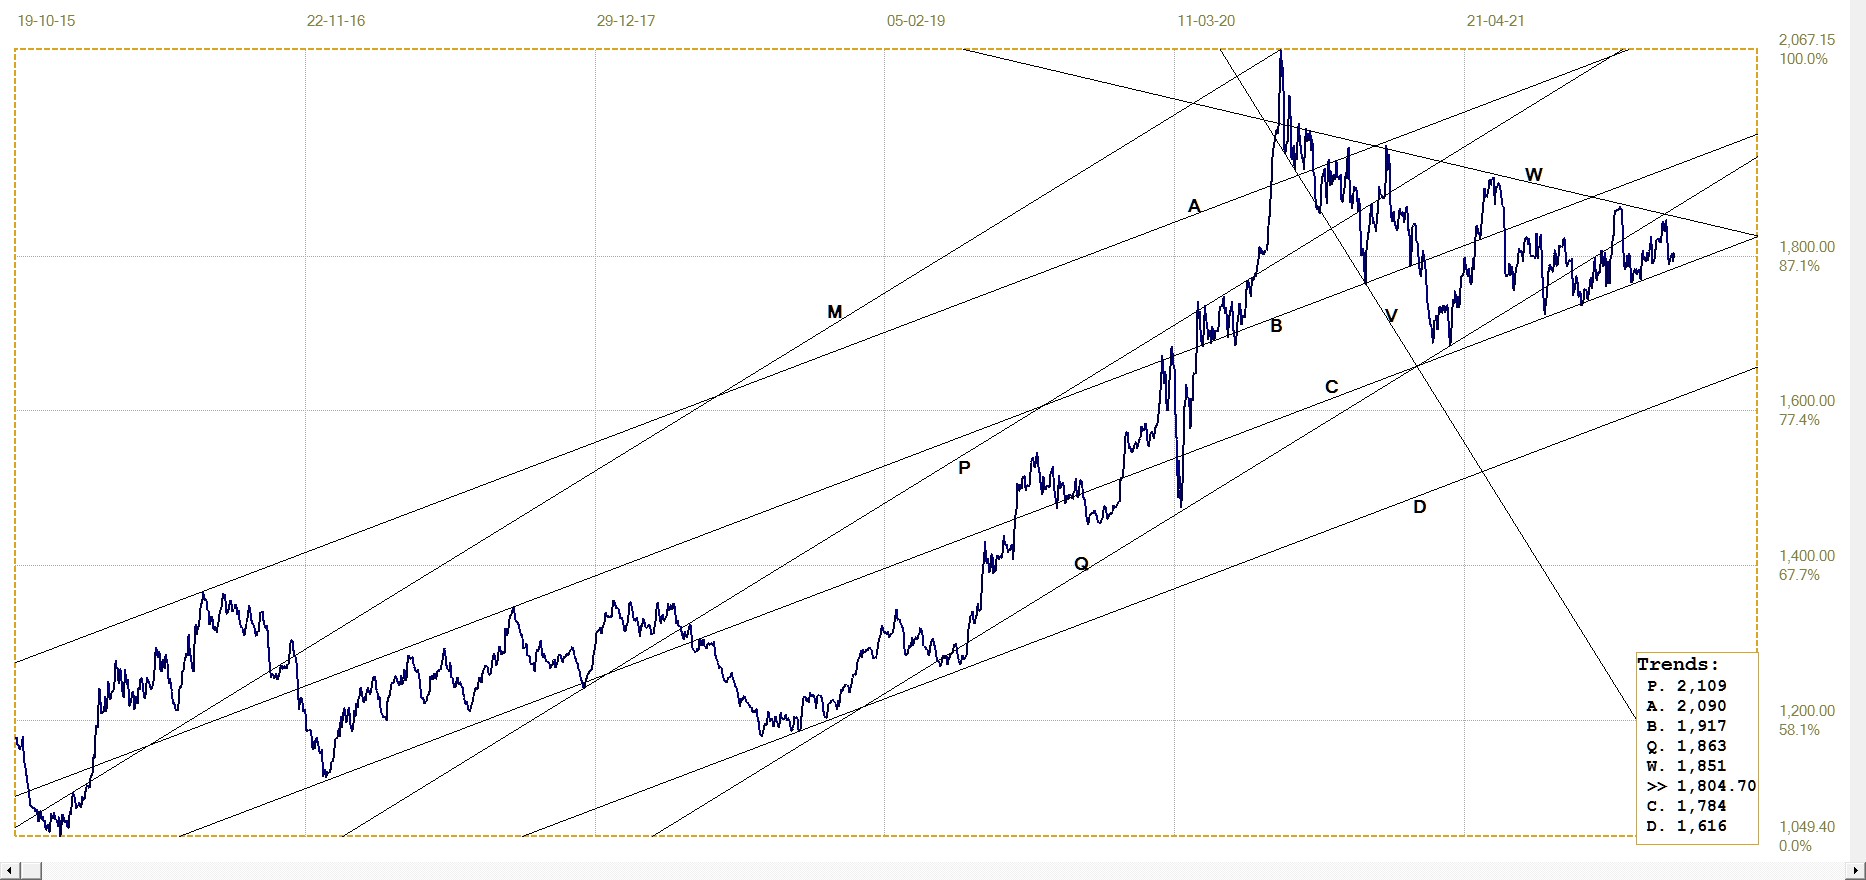
Gold price – London PM fix, last = $1804.70 (www.kitco.com)
The price of gold is struggling to hold the $1800 level, with some minor success and frequent failures. Since shortly after the new high above $2000 in August 2020, the ceiling price for gold has constantly declined to only occasionally allow a fix above $1800. At the same time, the price has been climbing steadily after hitting a low at $1684 in March last year. The result of the falling ceiling and now rising floor is that the price is forming a triangle.
The wave count within the triangle is not exact, bur clearly already exceeds the typical 5 legs with a triangle. Gold and the currencies are the only time series that frequently form triangles of longer than the standard duration in terms of the leg count. Perhaps this is an indication of a market that typically suffered from frequent intervention; if so, it is probable that as major intervention proliferates, other markets will also form extended triangles and wedges.
It looks as if the triangle will narrow enough to force a break before the end of 2022, which, while not good news for the near term, at least holds a bullish promise.
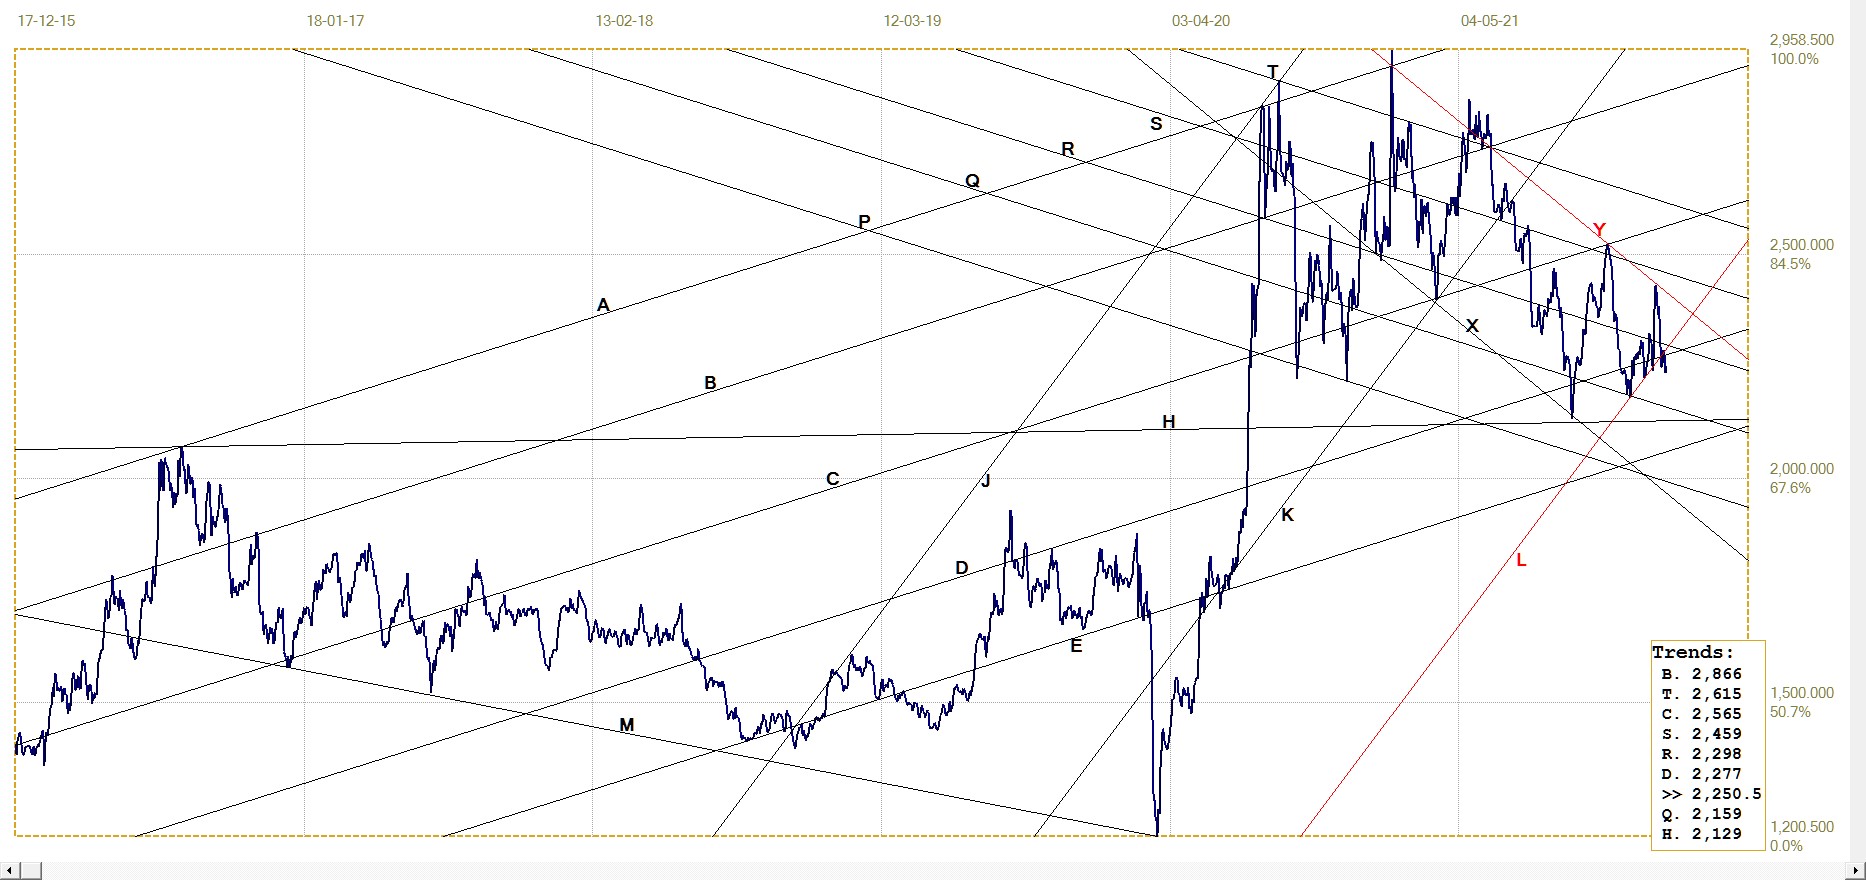
Euro–gold PM fix
Euro gold price – PM fix in Euro. Last = €1580.56 (www.kitco.com)
When the dollar lost ground last week, the euro was a winner, but the dollar price of gold struggled to hold near $1800, with no hope of being allowed to rally on a weaker dollar. The result is that the marginal break below channel QR 10 days ago extended much lower, nearly to the top of channel XY. The new weakness canceled almost the full rally since the rebound off line R early in December.
The outlook for the euro price is now mostly sideways, perhaps to hold above channel XY for the near future. As discussed last week, the dollar is looking bearish so that the euro should react in contrary fashion. On the other hand, the price of gold is expected to remain mostly sideways within its triangle, which will keep the euro price of gold under pressure and at best only managing to hold above channel XY.
Silver Daily London Fix
Silver daily London fix, last = $22.50 (www.kitco.com)
The price of silver managed to spike higher and reach the top of its bear channel XY two weeks ago, only to reverse as smartly and then break below its bull channel KL late last week. Silver does not have a well defined ceiling as the one that blocks any gold rally; silver is more volatile and for some time has battled to hold in channel KL until the sudden rally to test resistance at line Y.
The net short position of the Commercials was reduced by more than 9500 contracts during the week to 31 January, which reduces their risk should the price of silver spike higher. This means the steep drop on the price during that week favoured them. If the trend is to continue, perhaps increased selling by the hedge funds could reduce the risk further to where price suppression is no longer as important as it has been for a long time.
U.S. 10–year Treasury Note
The yield is still holding in its narrow bull channel KL. The break above line C spent a few days consolidating the break and tested line C before a small spike higher reached line K. So far, the bond market is reacting as if inflation is expected to continue higher and this will be confirmed should the yield soon break into channel JK.
Given the jump in the month on month change in the CPI from about 6% in November to 9% in December, it still looks possible from the behaviour of the yield that the CPI for January could be 1% or higher.
10–year Treasury note, last = 1.916% (Investing.com )
The price of energy has a pervasive influence on the inflation that is being measured throughout the whole economy. The spike higher to above $90/bbl after the break above resistance along line C increases the probability that the month on month CPI for February – if not already so for January – will exceed 1% to warn of double digit inflation coming soon in 2022.
Were that to happen, the psychological effect will be significant. The Fed always speak more about the risk of ‘inflation expectations’ rather than actual inflation. When the official rate exceeds 10% on an annual basis, expectations of higher inflation will soon compel a change in consumer behaviour – which will take a great deal of effort to first contain and eventually to neutralise. Just ask Volker!
©2022 daan joubert.
*********


