A Look At Gold And Silver For 2015 And Beyond


There is only one reason to make an investment: expectations that one will come out of it with more money than one came in. So have gold and silver rewarded investors since 1969, the year when gold first appeared on investors’ radar after being fixed for decades at $35 an ounce? During the 1970s bull markets, gold and silver’s gains exceeded those of the Dow Jones. During the eighteen year Dow Jones bull market from 1982 to 2000 investors realized a gain of 1380%. Not a bad return, but in the eleven years from 1969 to 1980 gold increased in price by 1918% and silver by 2869%.
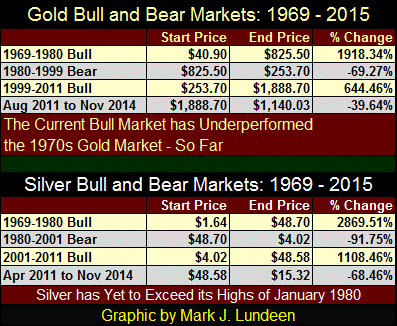
Unfortunately the 1980-1999 precious metal bear market was punishing. Gold lost 70% of its value over these two decades while silver bullion’s decline was reminiscent of stocks during the Great Depression: a shocking 92%. But those were the bad old days. Since 2001 gold and silver have seen some solid gains, notwithstanding the current bull market correction that began in 2011.
Is the current decline in the old monetary metals a “correction”? I believe it is because none of structural problems from the 2007-09 credit crisis have been resolved in the past six years. The global central-banking system response to the credit crisis has been to provide massive “injections” of “liquidity”, allowing their banking system to double down on the same losing bets that drove the financial system into bankruptcy in 2008. When push once again comes to shove in the financial markets, gold and silver will have no competition in attracting trillions of dollars seeking safe harbor in the storm.
It’s important to understand that today’s gold and silver market have nothing in common with the early 1980s, the early years of a two decade long bear market in precious metals. Back in 1980, gold and silver were fully valued in a world with double digit US Treasury bond yields across the entire yield curve and a Dow Jones’ dividend yield exceeding 6%. At the top of gold and silver’s last bull market, the Fed Funds Rate was approaching 20.00%; today it’s 00.12%! With the benefit of 20/20 hindsight, thirty-five years ago a historic bull market in stocks and bonds was baked into the cake while gold and silver had no place to go but down.
Today, after four decades of appreciation, the yields for these grotesquely inflated financial assets are all near historic lows, with no place to go but up. Which is just another way of saying that stocks and bonds are fully valued, they have no place to go but down in an extended bear market. And when we consider that the stock and bond markets are collateral for untold hundreds of trillions of OTC derivatives, it becomes obvious that the financial industry is once again at great risk of melting down. Since gold and silver bullion have zero counterparty risk, their safe haven appeal to wealth in full flight from counterparty failure will be crystal clear in a big market turndown, as was the case after the metals bottomed in October 2008 during the mortgage crisis.
Considering everything, early 2015 sounds like an excellent entry point into precious metals, but the question on every one’s mind is when will all this finally cause the price of gold and silver to rise above their last all-time highs? Sorry to say that I don’t really know when, only that I’m sure it will.
Let’s look at the long term charts for gold and silver, first gold. The bull market that began in 1999 doubled the gains of the 1970s bull market, in dollar terms. But the dollar is an undefined unit of account; since currencies are no longer backed with gold, the dollar’s purchasing power has changed from one decade to the next as more and more unbacked dollars are created by the Keynesian controlled Federal Reserve. Trust me on this, the $785 which gold gained from 1969 to 1980 did far more for investors’ living standards than the $1635 appreciation during the current bull market, which is why I prefer to use percentage terms when comparing one bull market to the next.
I’ve provided the table in the chart below as a reminder that the percentage gains of the 1999 to 2011 bull market were less than half those realized in the 1970s, despite how it may appear in the chart (distorted by years of monetary inflation).
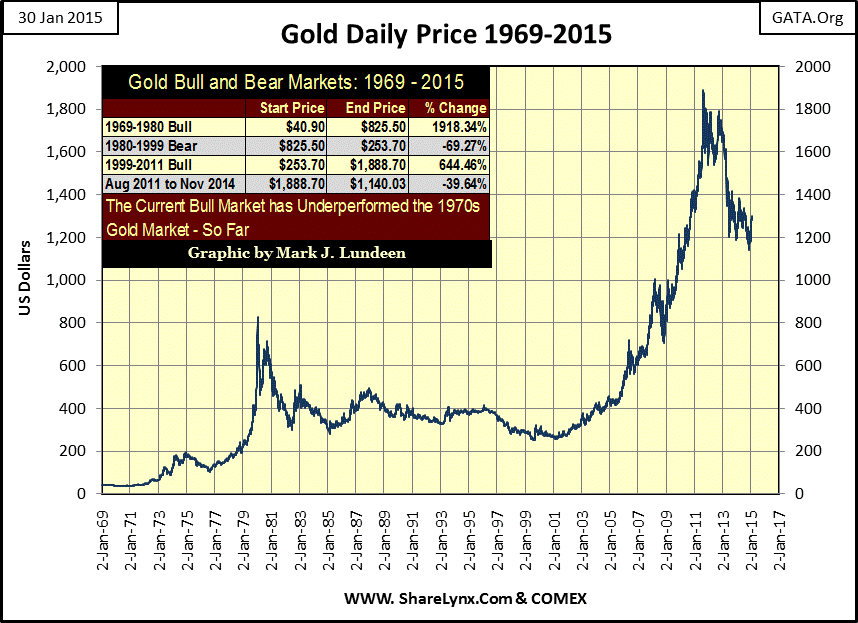
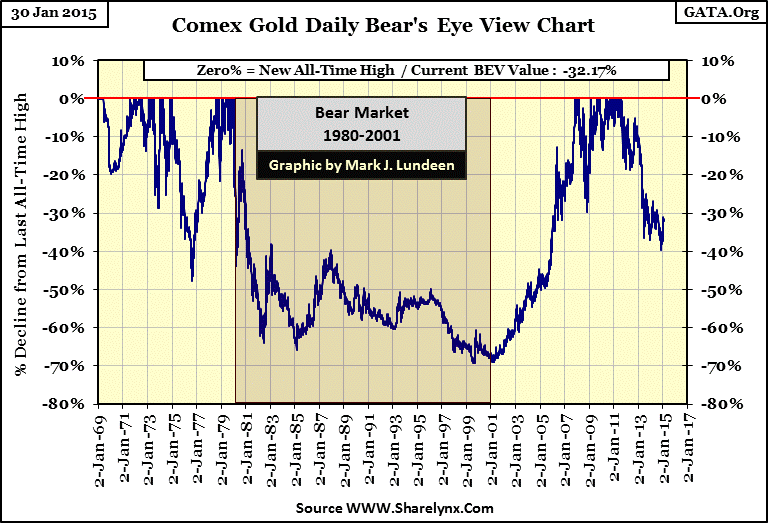
From its August 2011 high to its November 2014 low, gold has declined by 40%. Without a doubt it would’ve been better to have sold in 2011 and maybe come back in now. But as seen in gold’s BEV chart below, the price of gold suffered a 48% decline during the 1970s. Who even remembers that now? I expect about as many people who will remember the current 40% decline ten years from now. So if you didn’t sell in August 2011, now is not the time to bail, because the current bull market in gold has a long way to go, both in dollar and percentage terms.
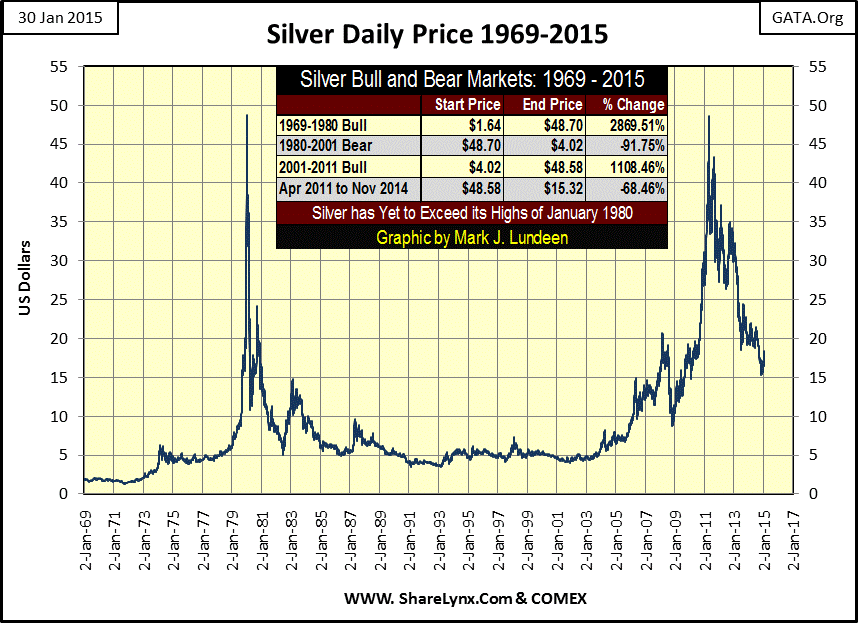
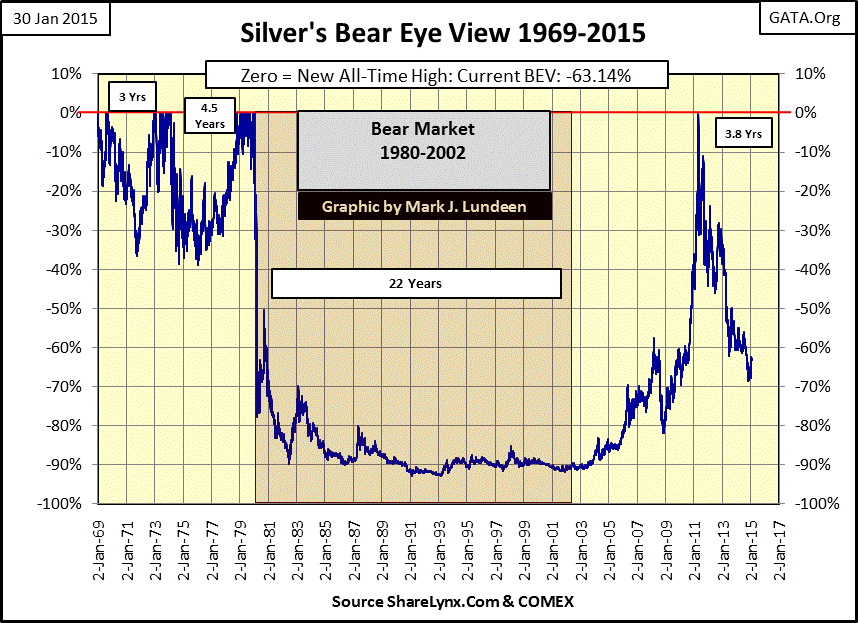
Here’s a chart plotting the price of silver over the past forty-six years. The most amazing thing about the current silver bull market is that fourteen years after its start, it still has not taken out its January 1980 high; missed doing so by $0.12 as seen in the table on the chart below. Still, silver did outperform the current gold bull market by a few hundred percent at its top in April 2011. Unfortunately, since 2011 it has also substantially underperformed gold on the downside. When comparing silver to gold it becomes obvious that price movements in silver are actually leveraged plays on gold during both good times and bad since 1969; like it has since April 2011 as silver declined by 68%.
It’s obvious from the BEV chart below that silver’s current bull market correction is unique. Nothing remotely similar occurred during the 1970s, so how can I claim that silver is still in a bull market? Given the growing industrial demand for silver in medicine, solar power and electronics, plus the vanishing silver stockpiles caused by many years of underpricing making it uneconomic to recycle, I find silver’s current low price simply incredible.
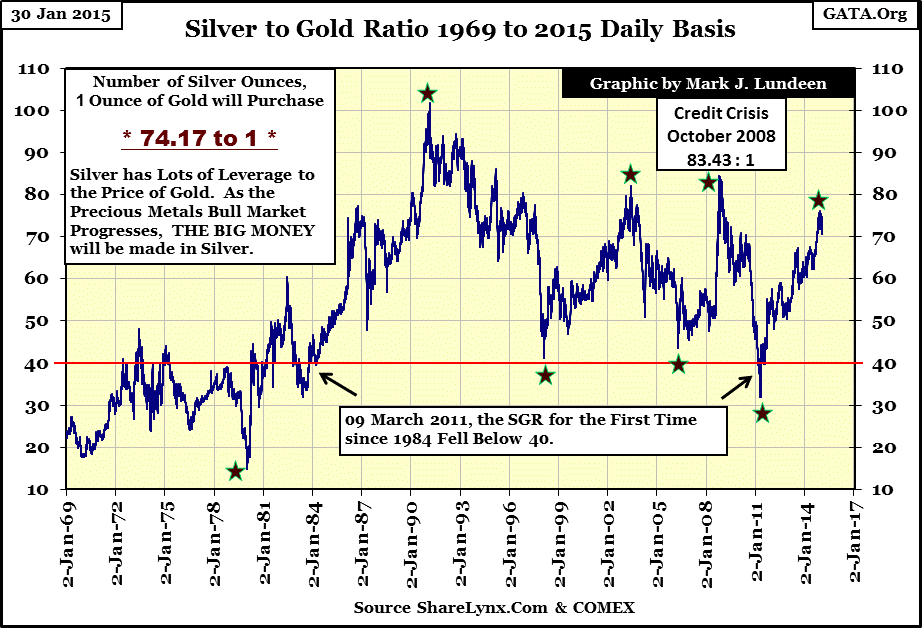
The US Treasury once had billions of ounces of silver bullion in storage as silver was used to coin money from colonial times through 1965. This was true for many, if not most national treasuries during the 20th Century. But after the early 1960s silver was demonetized, and base-metal coins began circulating in the global economy. Today the silver once hoarded by national treasuries is long gone, sold into the open market where it was used – but not recycled. Today, above ground silver is actually rarer than gold, yet an ounce of gold will purchase 74 ounces of silver, as we see in the chart below. Silver bullion is truly the most compelling investment available to retail investors today. This isn’t true for fiduciaries managing tens or hundreds of billions of dollars, simply because the physical silver market is too small a pool for these whales to swim.
Let’s take a quick look at gold and silver’s step sums since 1969; but first what’s a step sum? A step sum is a single item Advance – Decline Line using the daily closing prices of a market series. The step sum provides a unique insight into the market sentiment of the only people whose opinion really matter; those who actively buy and sell every day. In fact, there are about as many up days as down in both bull and bear markets. However during bull markets there is a small bias for more up days, (as in bear markets there’s a small bias for down days), but this is not always the case as we’ll see later on.
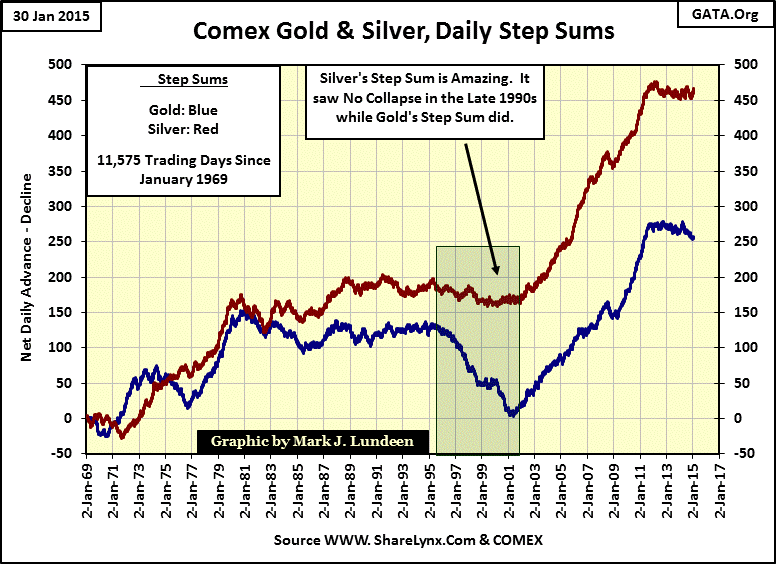
Above we are looking at the last 11,575 trading days for gold and silver, beginning in January 1969. The step sum plots for gold and silver illustrate the net number of Advances – Declines during those 11,575 trading sessions. For gold (Blue Plot) we see 256 more up days than down since 1969, while silver (Red Plot) has seen 466 more up days than down.
Below we see gold’s step sum chart from 1998 to present. From January 1998 to early 2001 the price of gold was range bound between $250 and $325 as the 1980 – 2001 bear market came to an end. Note what its step sum was doing: collapsing as it reflected the abysmal market sentiment for gold. The investment universe at that time was fixated on the high-tech 21st Century: a future where everyone agreed with Alan Greenspan that gold would have no place alongside silicon chips and software. But note that from 1998 to 2001, when the gold market was seeing far more down days than up, the price of gold stubbornly refused to break below $250.
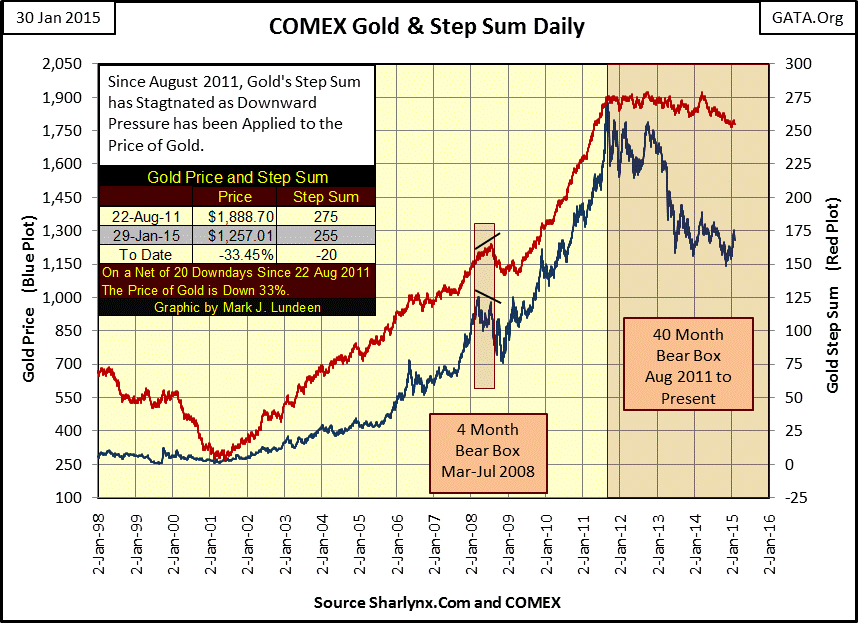
Then during the summer of 2001, a year and a half into the “Tech-Wreck” bear market, gold began to rise along with its step sum, marking the beginning of our current bull market. The price of gold continued to rise along with its step sum until March 2008, the beginning of the credit crisis, forming a four month bear box. A bear box occurs when the price and step sum trends split, as occurred from March through July 2008 when the price of gold (market reality) declined as its step sum (market sentiment) continued to rise. After four months of declining gold prices, market sentiment once again fell in line with gold’s price trend. Both trends would reverse to the upside several months before the credit crisis bottomed in March 2009.
The most significant technical formation in the chart above is the current forty month bear box which began at gold’s last all-time high (August 2011). The price of gold may have declined by 33%, but has done so on a net decline of only 20 down days over the past forty months. What does this all mean? A glance at my crystal ball seems to say that the bulls have no intention of exiting the gold market, as they did from 1998 to 2001. Lower gold prices today are not inspiring thoughts of selling gold, but of buying more at these depressed price levels. This is certainly the case for Russian and Asian central banks, huge institutions which for many years have been purchasing hundreds of tons as frequently as possible, and taking their gold home with them. By the look of gold step sum plot above, foreign central banks have been doing exactly this since August 2011 at very attractive prices.
Usually in my step sum comments I note how the step sum typically begins a collapse in a bear box, which signals the final decline in the price plot. But that observation came from my studies of the Dow Jones from 1900 through 1999 when bear boxes form toward the end of a bear market, signaling the bulls have prematurely entered a market still in decline.
Since the year 2000, step sum box formations no longer work as they once did. Today step-sum bear boxes are likely to form on day one of a bear market. The most likely explanation for this is that today’s bulls are economists, politicians and bankers with unlimited inflationary funding now have their meat hooks deep into the daily workings of our formerly free markets. These bulls are not primarily motivated by profit, but to achieve an economic or political adjective.
For this reason I have my doubts that gold’s current bear box will ever see a proper collapse in the step sum plot. I expect that one day we’ll wake up and the financial media will be in a state of shock over some unexpected news development, which will invalidate gold’s step sum bear box, meaning we’ll see gold’s price and step sum plots enthusiastically resume their upward trends begun in 2001.
Silver’s step sum chart looks pretty much the same as gold’s, except that silver, as usual, is a leveraged play on the price of gold in both bull and bear markets. Note that since the beginning of silver’s current correction its step sum is up a net of five day as its price plunged 65%. No doubt lower silver prices have not discouraged the global consumption of silver for industrial and investment purposes. Like gold’s current bear box, I expect silver’s step sum will ultimately refuse to collapse.
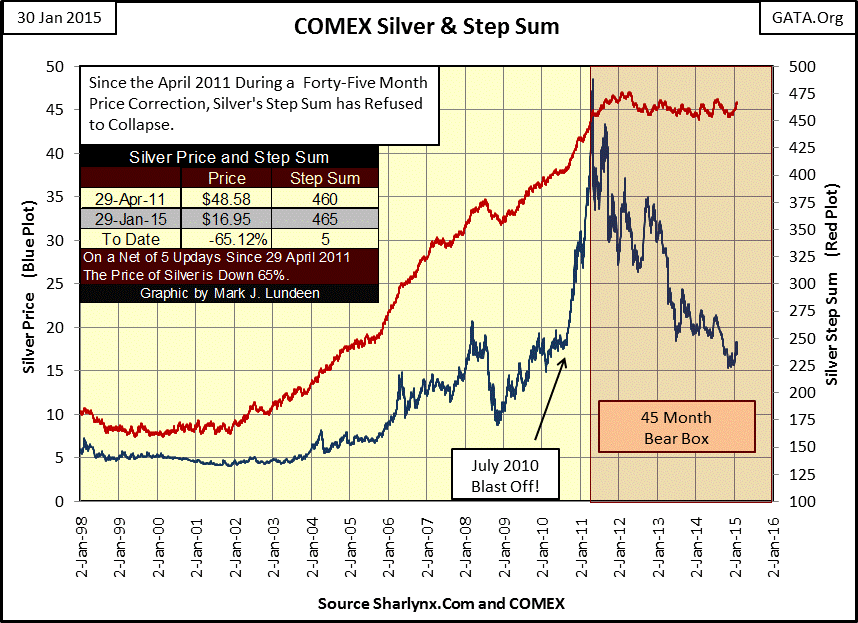
Look at silver’s price and step sum table in the chart. The price of silver is down 65% on a net increase of five up days since April 2011. I realize that it takes a lot of selling, well in excess of demand to drive the price of anything down 65%. But do the people who are bearish on the old monetary metals realize that the supply and demand driving down the price of gold and silver is the supply and demand for paper futures contracts, a market where metal is “promised” to be delivered at some future date, but typically never is. These banks “promising to deliver” silver aren’t miners, and have no real interest in the silver industry other than to contain its “market price.” That makes $17 silver (the current market price) an officially sanctioned fraud. Same goes with $1200 gold. When actual market supply and demand once again regains pricing control over precious metals, you’ll be glad to own some physical bullion.


