Looking for Reasons to Sell the Stock Market


There are times when one should be looking for reasons to buy in the stock market. This is especially so after a big market decline, when fear prevents most market participants from acting in their own best interests; like buying stocks after they’ve declined 30% or more.
But there are also times when one should be looking for reasons to sell. This is especially so after a huge eighteen month, 86% market advance for the Dow Jones, a time such as now. Though I have been out of this market for a long time, I’m still looking for reasons to sell, even though I recognize the possibility this advance may continue for months to come.
This market advance is beginning to be interesting to a big-bad bear, such as myself. There isn’t any mass panic yet to be seen on the TV. The main-stream financial media has yet to air PSAs with Warren Buffet assuring the public all is well. All the same, I can see some cracks in the foundation of our current market advance, an advance that began from the 20 March 2020 market bottom.
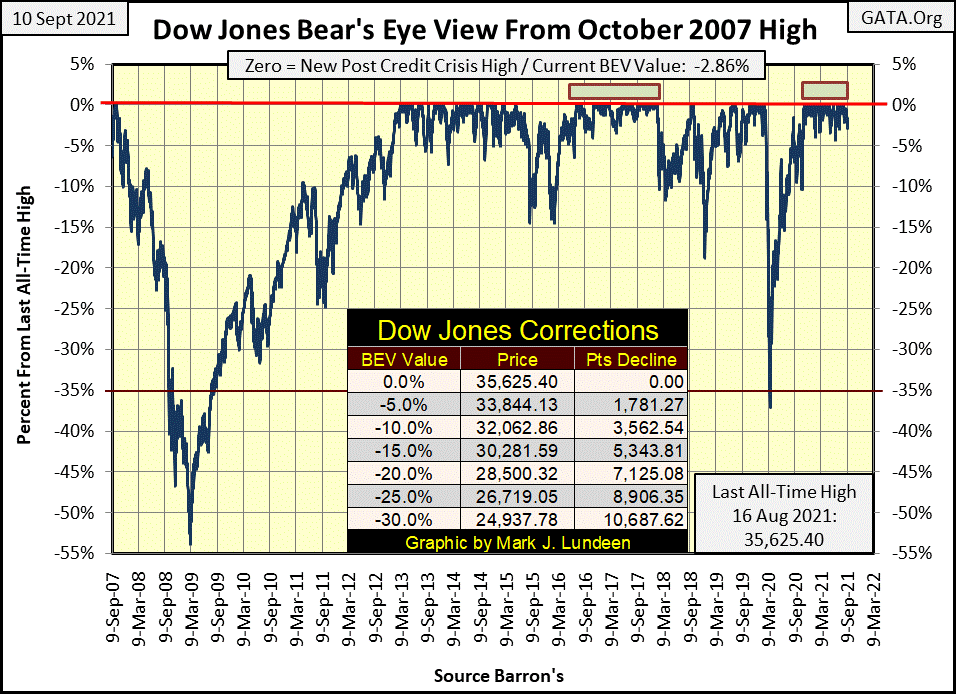
The first crack to note is the Dow Jones hasn’t seen a BEV Zero since August 16th, some eighteen NYSE trading sessions ago. Nothing Earth shattering about that. But the longer the market has to wait for the Dow Jones to make a new all-time high, the least likely it is that it will. This is especially so after a continuous, and uncorrected eighteen month advance for the Dow Jones that inflated its valuation by 86%.
Is that it? No, there is more.
The Dow Jones closed the week with a BEV of -2.86%. This is well within scoring position; less than 5% from the Dow Jones’ last BEV Zero. But this BEV of -2.86% is the deepest decline in the Dow Jones since its last all-time high of August 16th. In other words, the trend in the Dow Jones is now trending down. It would be very easy to change this. All the Dow Jones has to do is once again make a new BEV Zero in its BEV chart below. But will it?
Also, the NYSE 52Wk H-L Nets are becoming noticeably weak. No longer the strong >+300 values frequently seen from January to June of this year. Since August 16th, the H-L Nets have only produced positive, but weak triple and double digit values, and an occasion negative Net. More on this later.
Moving on to the Major Market Indexes BEV Table below, ignoring last Friday’s data (September 3rd), the major market indexes only made two new all-time highs in our holiday shortened (Labor Day on Monday) trading week. It was a holiday shortened week, and the week did close with seventeen indexes in scoring position, less than 5% away from making a new all-time high. Still, the scarcity of BEV Zeros last week, only two, stands out.
Keep in mind I’m looking for reasons to sell, tripwires to compel me to exit the market if I was in it, which I’m not. Should these indexes continue failing to generate new BEV Zeros, and one-by-one begin falling from scoring position (BEV values of -5.00% or more), that would not be a healthy trend for the market.
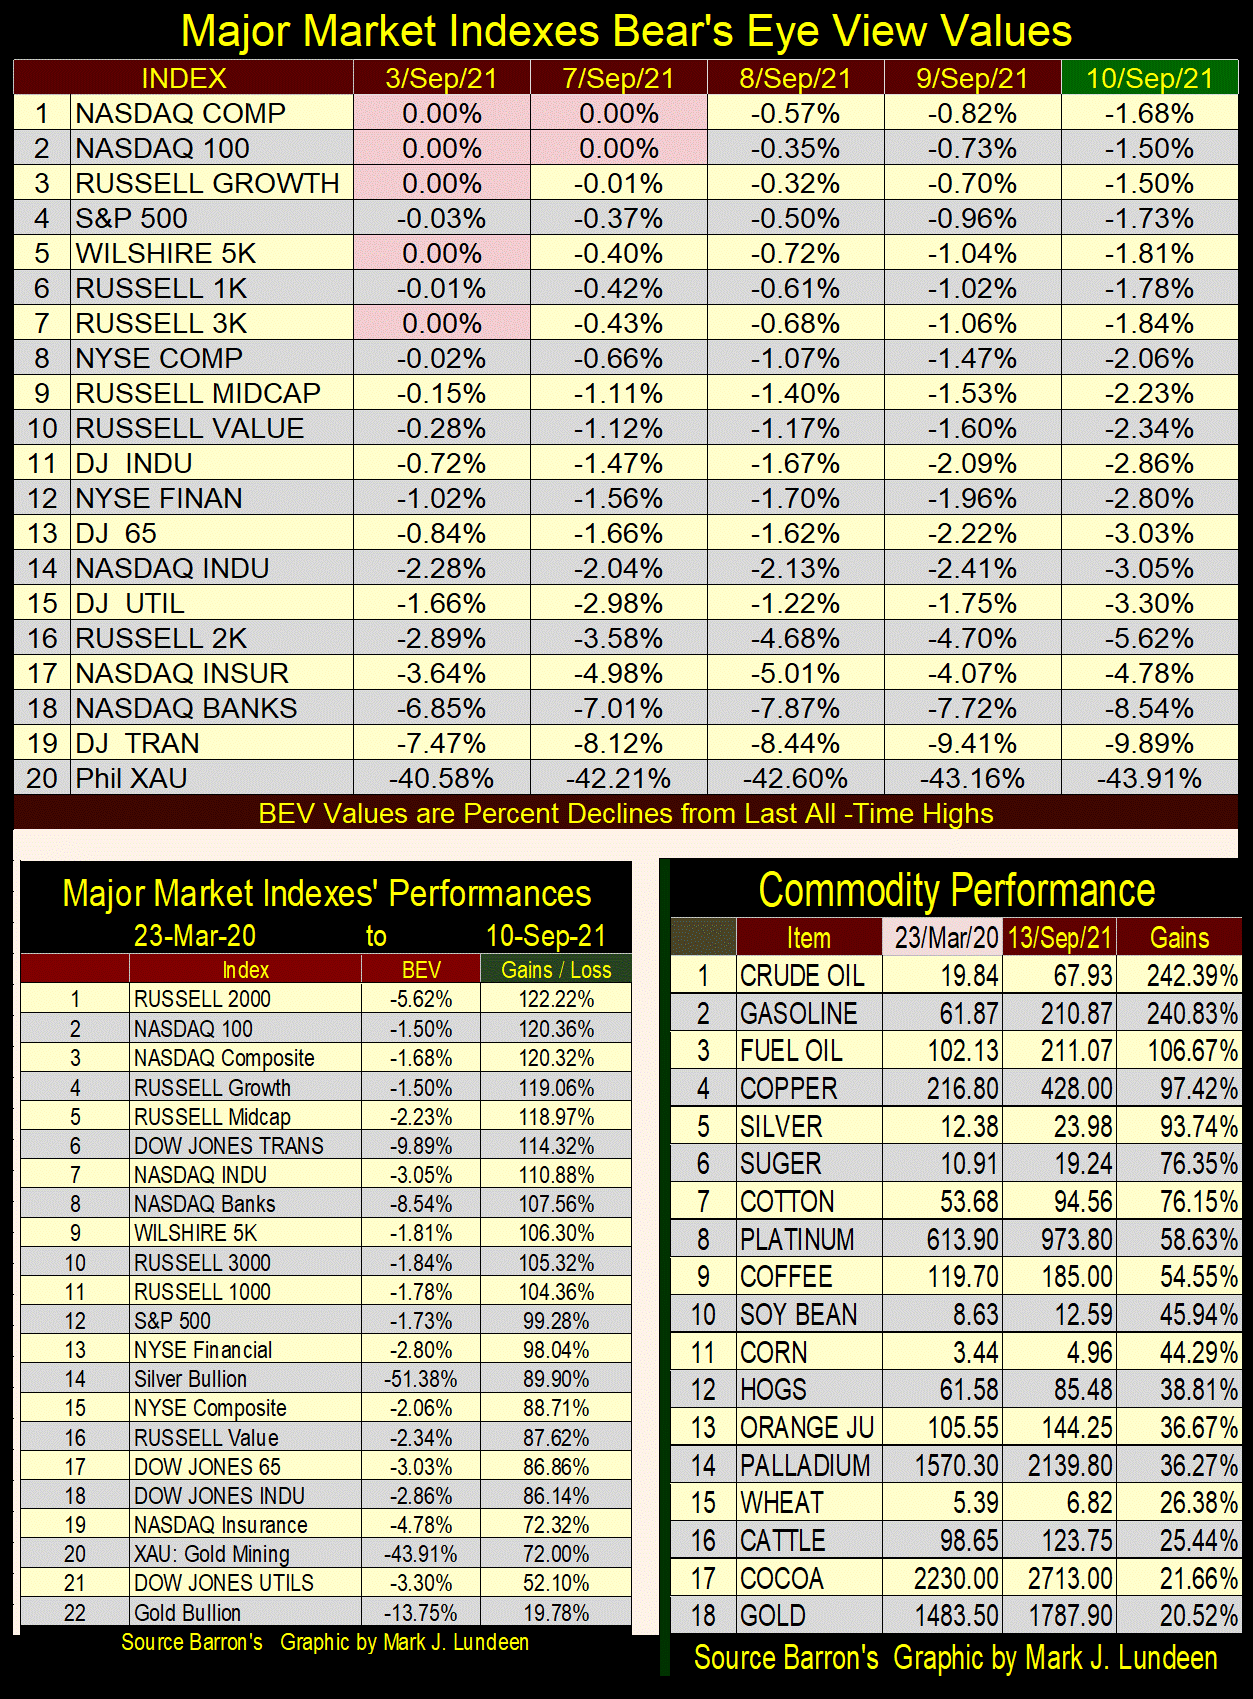
Looking at the gains these indexes have achieved since their 20 March 2020 bottom (left table above), at the close of this week, eleven have doubled in valuation, or more in the past eighteen months. And as seen by their recent inability to generate new all-time highs as they once easily did, it seems to me that, like the Dow Jones (#18), they too are in need of a rest.
What’s really bearish are the gains seen in commodity prices from their 20 March 2020 bottoms (right table above). “Liquidity” from Fed-Chairman Powell’s massive Not QE#4 (see below) is leaking into consumer prices. Should this continue, and it should, the bond market will soon demand an inflation premium to compensate bond buyers from rising CPI inflation. With higher bond yields, come lower bond prices, and rising bond yields are never good for the stock market.
As promised above, let’s look at the NYSE 52Wk H-L nets from the end of July.
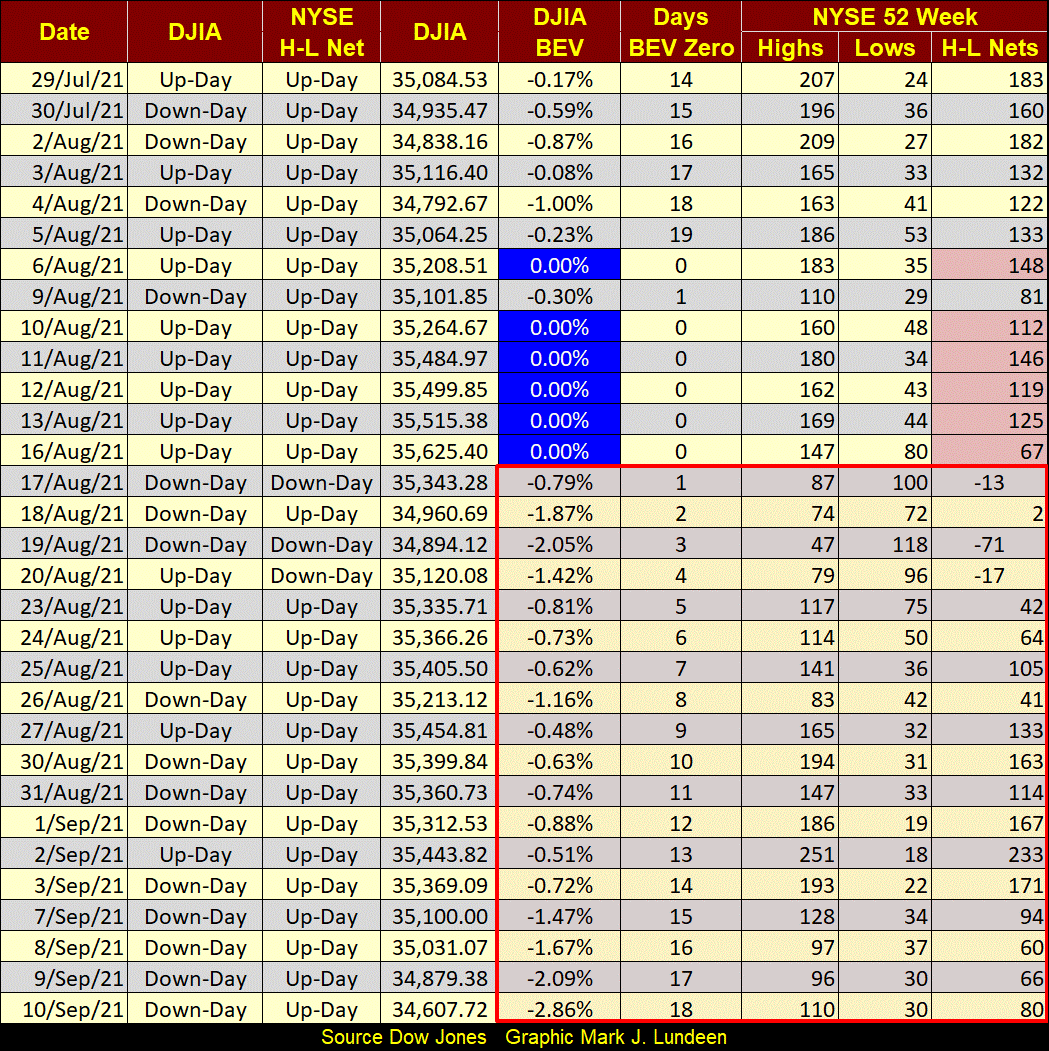
The Dow Jones saw six BEV Zeros in the first half of August (table below), which is good. But I notice the NYSE 52Wk H-L Nets accompanying those Dow Jones new all-time highs were on the weak side (table below / red cells). From January to June of this year, Dow Jones’ BEV Zeros, and sometimes when the Dow Jones was just short of making a BEV Zero, their accompanying NYSE 52Wk H-L Nets were deep into the 300s or more. How much more? 400s were common. On May 10th the NYSE saw a 52Wk H-L Net of 661.
But since the end of July, NYSE 52Wk H-L Nets have been lackluster. Is the stock market now enjoying a period of rest and recuperation? Or, is the Dow Jones BEV Zero of August 16th (table below) the Terminal Zero (TZ), aka the last all-time high of the advance that began off its March 20th bottom?
Even though I’m now looking for reasons to sell, I’m still going to assume the Dow Jones will continue making new all-time highs from here, as I’ve seen nothing to indicate the Dow Jones’ bullish primary trend has yet been terminated. What I’m looking for to inform me that the next big thing in the stock market is valuation deflation are extreme market events:
Days of extreme market volatility / Dow Jones 2% days
Days of extreme market breadth / NYSE 70% A-D days
Keep in mind, since its low of 20 March 2020, the Dow Jones has advanced much; over 85% in the past eighteen months. The NASDAQ Composite has advanced 120% off its 20 March 2020 lows. In market history, there are few eighteen-month periods, very few that have seen such large gains for mature, dividend paying blue-chip stocks. Can the market’s next eighteen months be like its last?
It’s best to be adults and just face the facts; this eighteen-month advance will soon come to its natural conclusion. I don’t know if that means days, weeks or months before the end. But I do know I don’t want any exposure to the market when Mr Bear and his clean-up crew begin clawing back from investors, what the FOMC gave them via monetary inflation.
Keep in mind I’m no one’s “investment advisor.” If you make any money off of my ponderings; well good for you. If you lose this month’s rent payment from anything I write; I don’t want to hear about it. I write these market commentaries because I enjoy doing so, as it forces me to come to grips with the market.
That said; looking at the weakness in the 52Wk H-L Nets above as we approach October, makes me think the Dow Jones (my proxy for the broad stock market), is approaching a tradable market decline. For those with a sense of adventure, which typically isn’t me, should the Dow Jones see a few 2% days, purchasing a few NASDAQ Composite put options would be warranted, as long as they don’t use this month’s rent money.
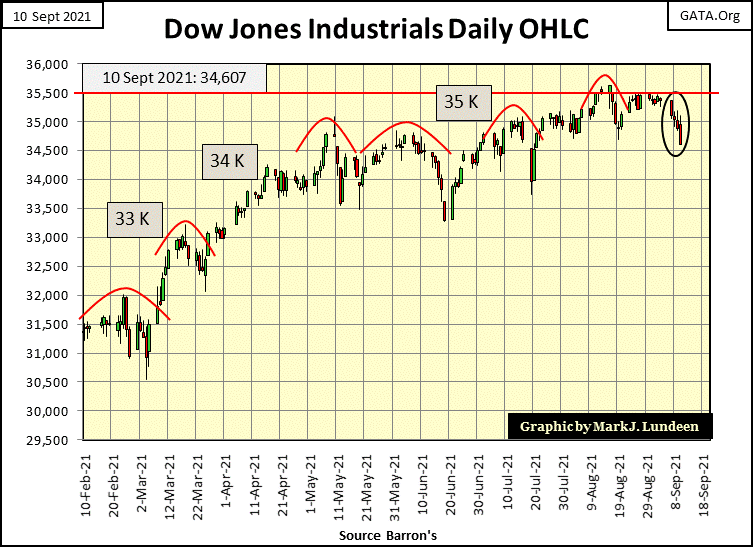
One last chart for the stock market. The daily bar chart for the Dow Jones closed this week leaving the Dow Jones looking very unappealing. Since May, the Dow Jones had a problem with 35,000. In August it finally closed above 35,500, but for only two days (August 13th & 16th). And then came this week with the Dow Jones seen deflating down below 35,000, closing the seek at 34,607.
What a stinky chart to close the week with. Should the Dow Jones close below 34,000 in the next few weeks, it wouldn’t be a positive development in the market. Can we be far from seeing some deflation and bear-market drama at the NYSE?
Here’s a bellwether-market event in the real estate market; the real-estate developer of the “most expensive home in America” has defaulted on their loans.

https://www.cnbc.com/2021/09/08/most-expensive-home-in-america-defaults-and-heads-for-sale.html
This house’s $500 million asking price was obviously a real-estate agent’s hallucination that would never come true. No matter, there is still the $165 million in development costs this property failed to meet before “The One” could be placed on the market. This house is now the property of its creditors. Can they sell it at a price ($165 million) to recoup their losses? Most likely. If they can’t; what does that say about the California real-estate market?
This is something to be expected at a market top, as the Federal Reserve has been “injecting liquidity” into the real estate market (and everything else) since the bottom of the NASDAQ Dot Com Bear Market in October 2002. They then went into overdrive at the March 2009 bottom of their Sub-Prime Mortgage Bear Market (yep, that was the FOMC’s bear market) with their three quantitative easings.
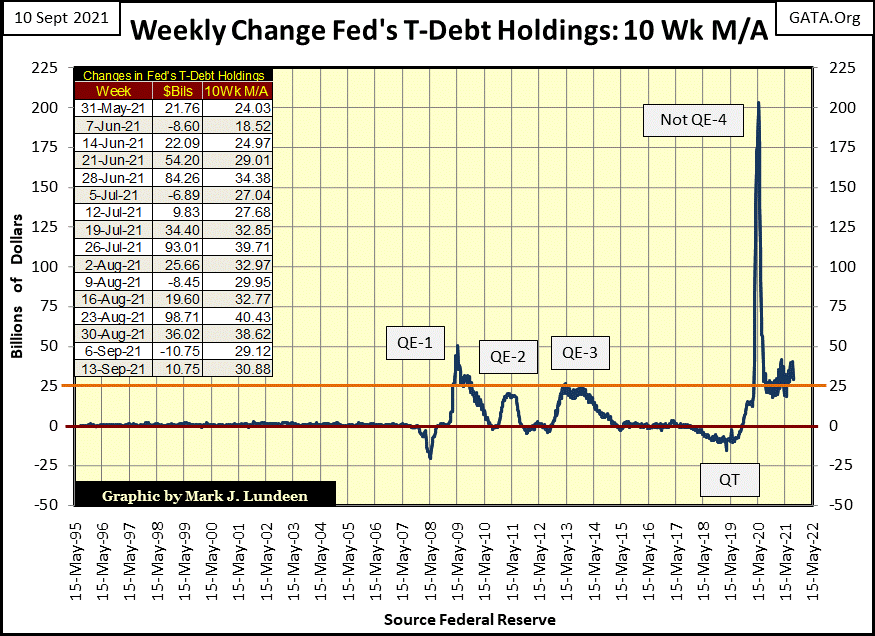
We can be sure this is also true for Chairman Powell’s Not QE#4, which began in October 2019, and continues to this day. The bear market to follow this inflationary bubble; the Dow Jones’ 444% market advance off its 09 March 2009 bottom (twelve years and four QEs ago / see below) will be epic.
Yes, that plus everything else that was pumped up with “liquidity” flowing from the FOMC. Which leaves gold and silver, as well as the precious metal miners looking pretty good in September 2021. Investors have called precious metal assets many things in the past few decades; overvalued was never one of them.
Look at all the inflation being “injected” into the markets in the chart below since January 2009? It went everywhere * BUT * into precious metal assets valuation. In a world plagued with overvaluations, investing in an asset class not artificially overvalued is a real virtue.
After a prolonged period of monetary inflation, as seen above, markets find themselves not only with inflated-market valuations priced for perfection, but also in a world with over extended balance sheets as far as the eye can see. Individuals, corporations and governments servicing crushing debts will crumble at the first shock of reality. Counter-party failure and debt defaults will soon become the market’s next dirty four-letter words.
So, why are mortgage rates at their lowest since the 1960s (below), possibly at historic lows? Market manipulation by the “policy makers.”
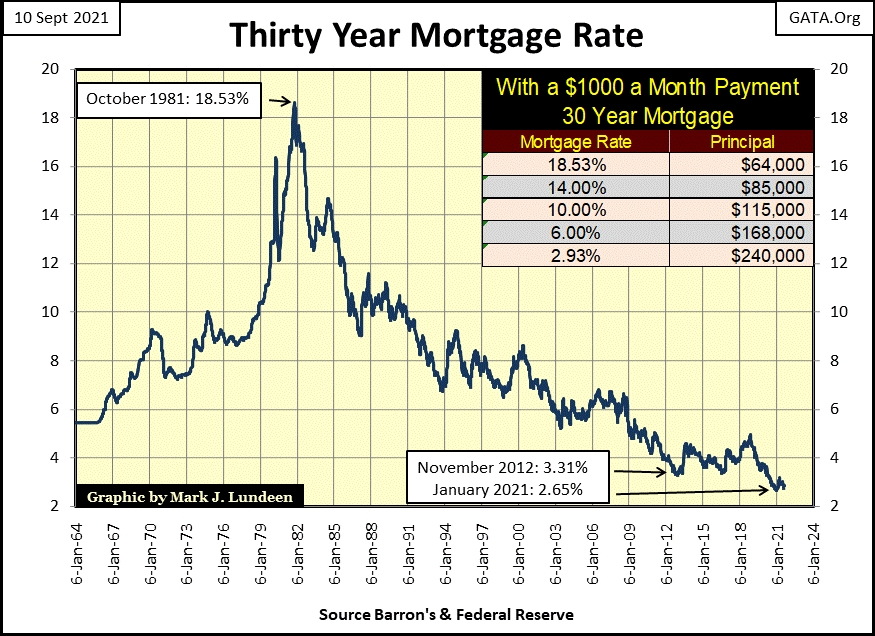
The FOMC buys mortgages at prices no one else is willing to pay. No doubt any bank writing a mortgage for the above $500 million dollar monstrosity, would have done so knowing the FOMC would have quickly purchased it from them at full price – no questions asked. After the horrors of the real estate busts of 2007-09, banks don’t hold mortgages as reserves any more. But the Federal Reserve does, buying mortgages to keep the real estate market awash with “liquidity.”
The fake news outlets may report the current real-estate market is “healthy”, if they make any comment at all. However, they are basing that judgement solely on rising prices, not on the prospects of all those mortgages supporting overpriced real estate being serviced to term.
Years ago, when I was going through old issues of Barron’s, I saw an ad in their real estate section that has remained with me to this day. I don’t remember the exact issue, sometime in the early 1940s before the US entered the war. I don’t remember the precise details of the property. If they were advertising in Barron’s, you can be sure it was a very nice home.
It was located in Virginia with a view of Thomas Jefferson’s Monticello, a large house on acreage, with multiple bedrooms and baths, horse stables and a guest home. The asking price: around $40,000, as I recall. The thing that stood out was a comment at the end of the ad; this home sold for over $1,000,000 in 1929.
So, during the depressing 1930s, in a little more than a decade, prime Virginia real estate deflated by 96%. Don’t think Mr Bear can’t do it again. He can, and he will.
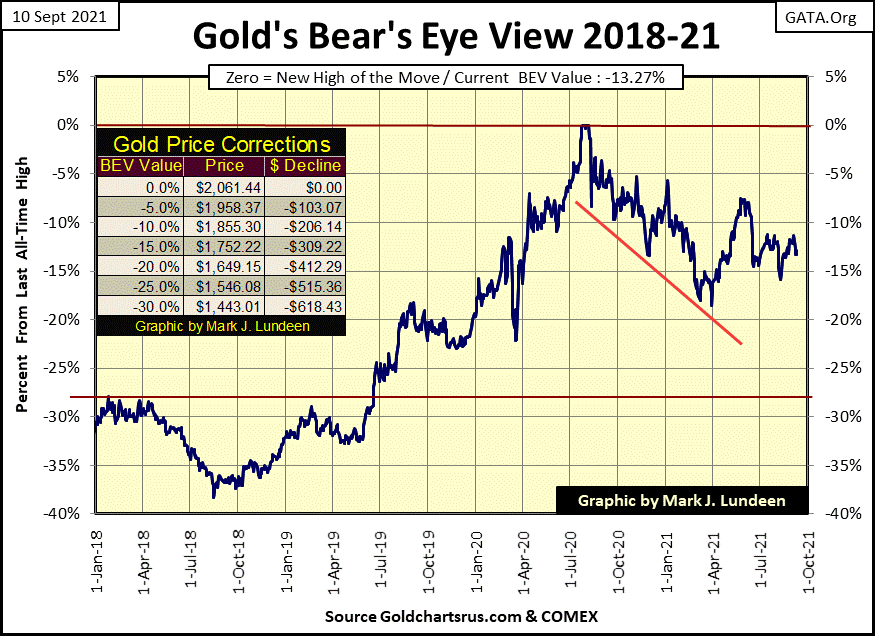
Let’s look at gold this past week. On Friday September 3rd (blue plot / top chart) gold saw a large advance.
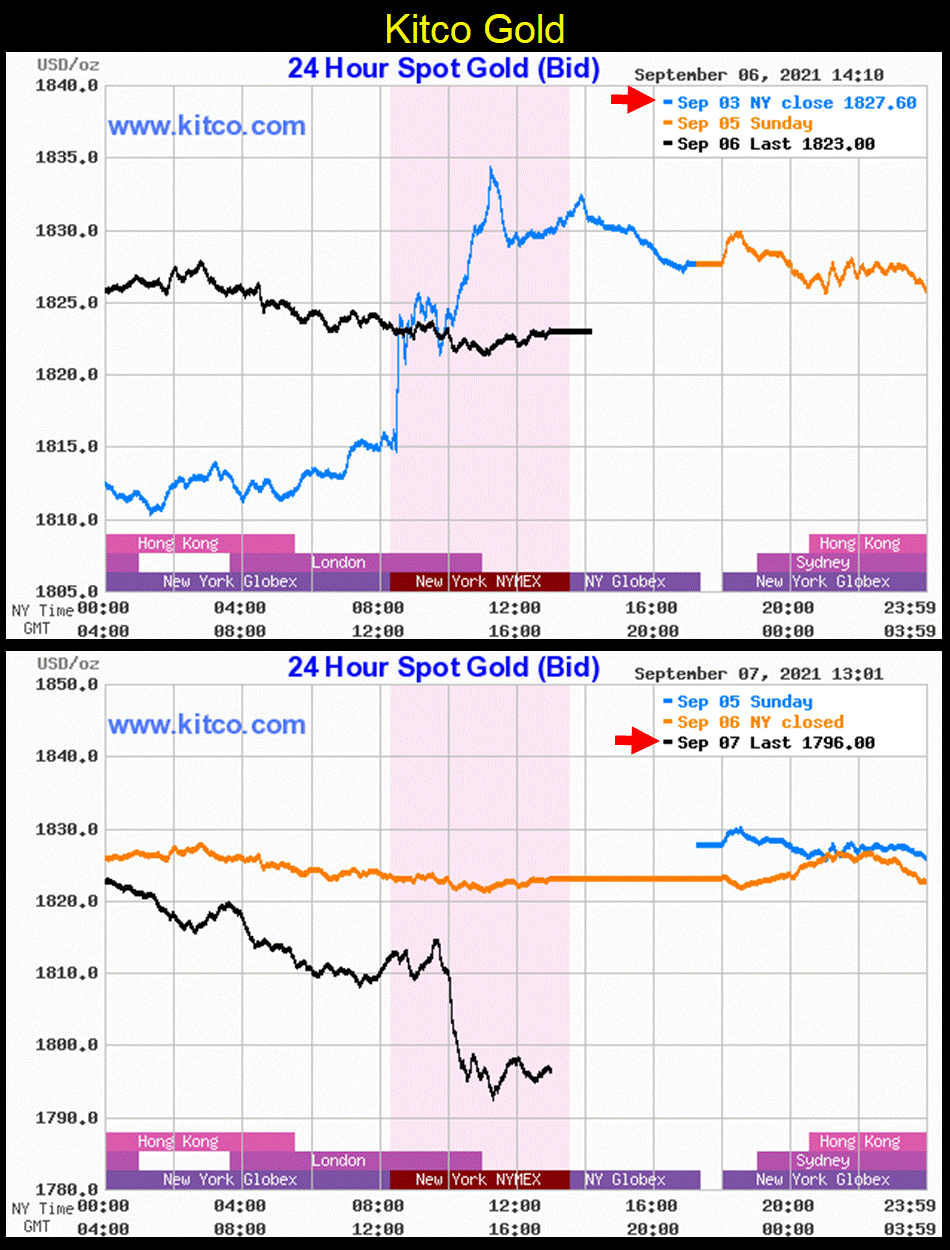
Then on the next trading day (Tuesday September 7th), COMEX goons once again flooded the futures market with paper gold, taking down the price of gold by a larger amount than it had gained on Friday’s advance. Pretty depressing stuff, and for all too many decades, this has happened all too many times, as government market regulators look on and do nothing about it. But this too shall pass.
Did the chart above leave you feeling depressed and helpless? Yep, me too, for about two seconds. At the close of Tuesday September 7th, I looked at my Bear’s Eye View (BEV) chart for gold (below), and saw the COMEX goons failed to drive gold below its BEV -15% line. Take a quick look at gold’s BEV chart below. Can you see last week’s mini boom and bust in it? I can’t. It was just another annoying non-event in the gold and silver markets.
Keep in mind; when the real-estate, stock and bond markets begin their pending, and unavoidable historic bear markets, flight capital will be desperate to find safety from deflation. Throughout market history, precious metal assets have provided a safe harbor in such times, and I believe they will do so again.
So, for the bull market in gold and silver to resume in earnest, we may have to wait until the Dow Jones and real-estate gets badly mauled by Mr Bear. I’m sure the wait will prove to be worthwhile and profitable for precious metal owners, and their miners.
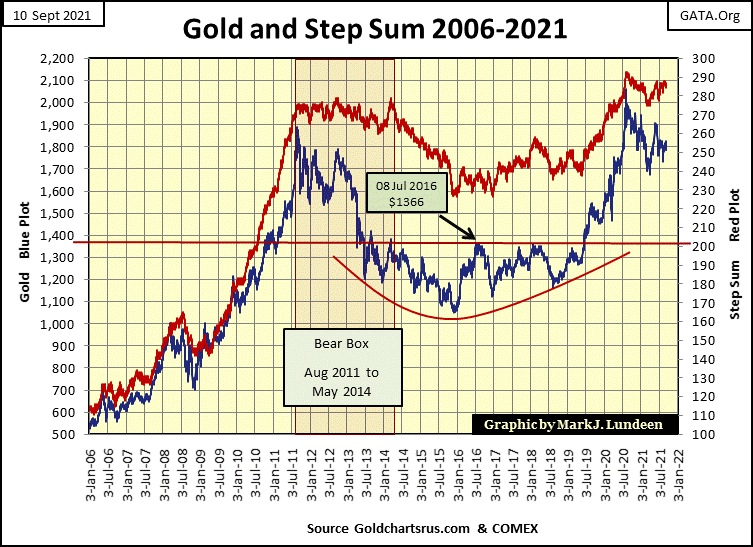
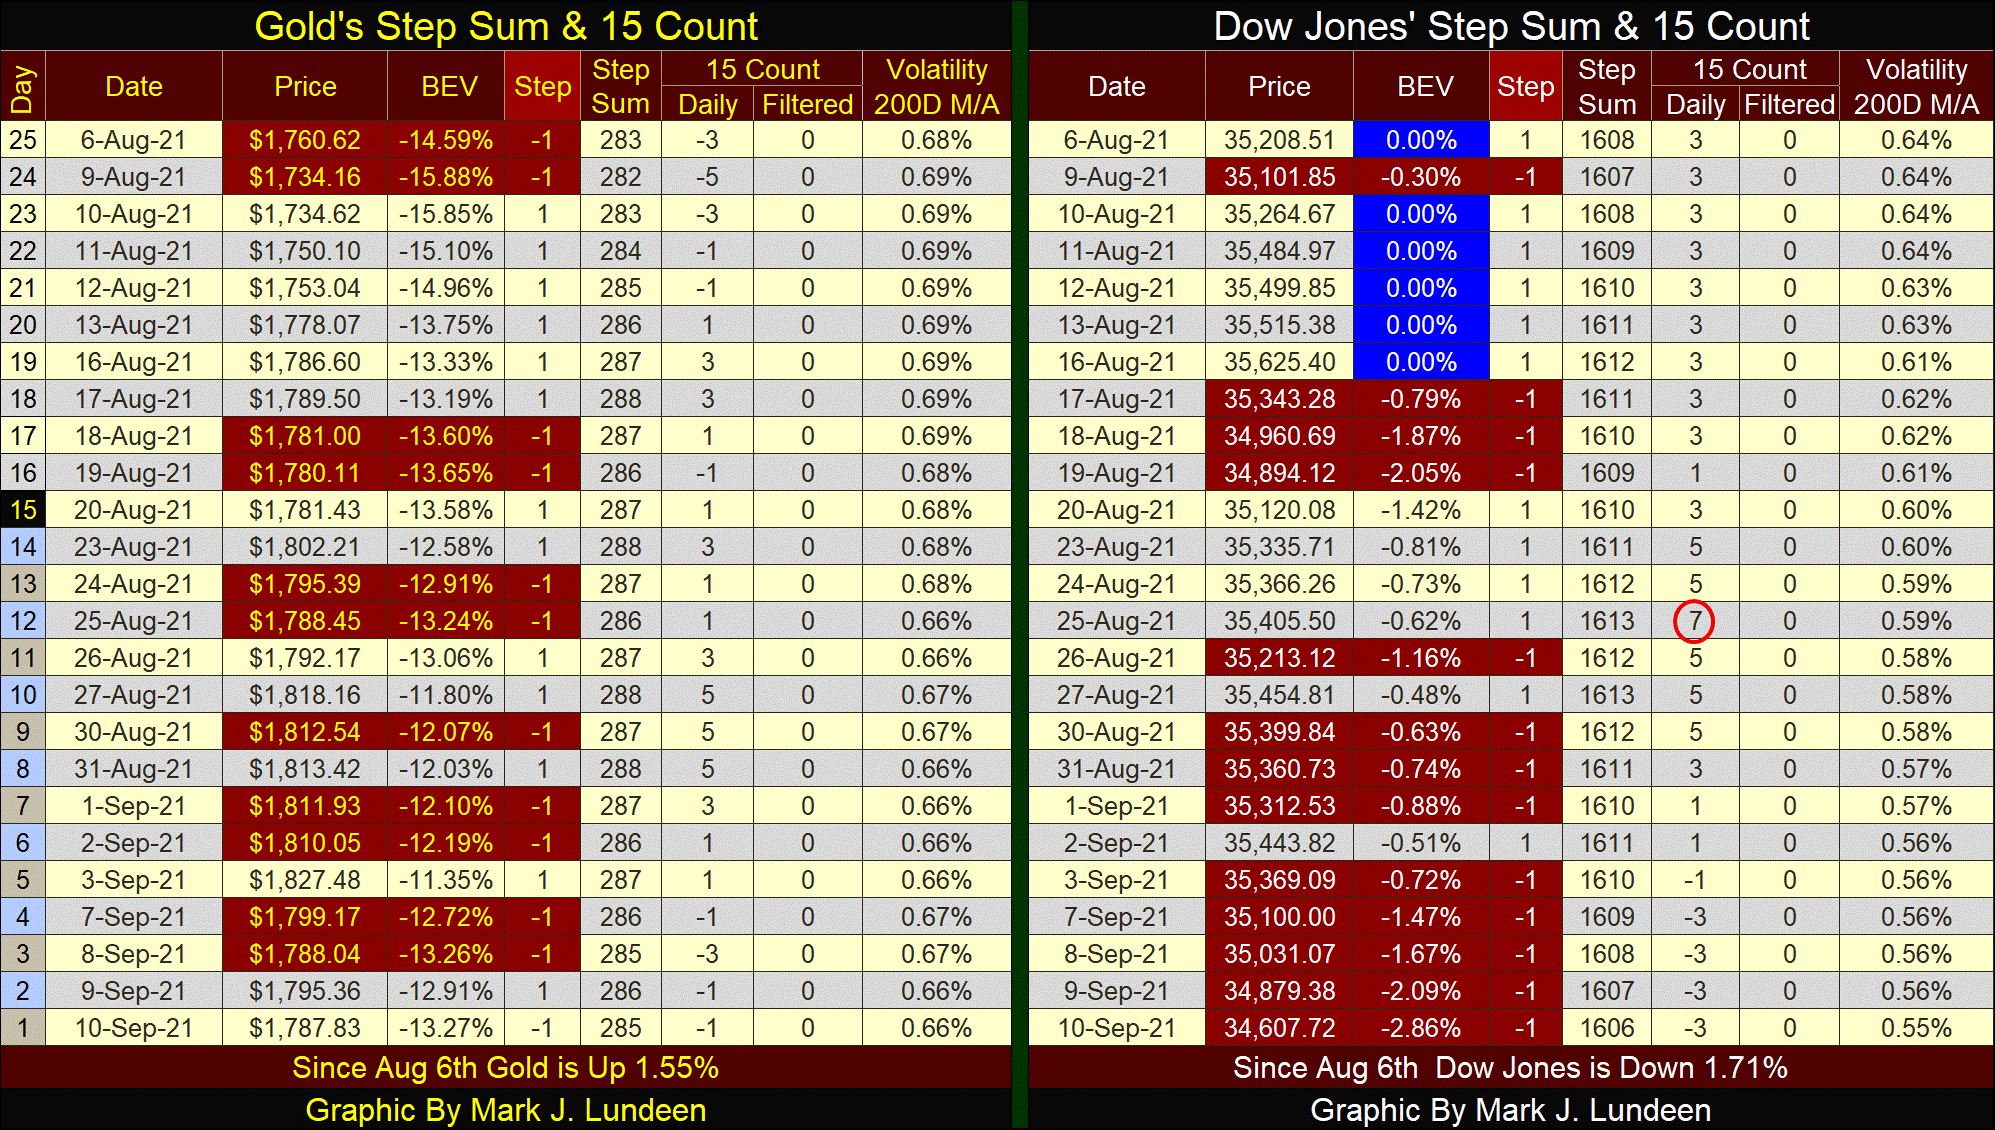
Gold and its step sum below continue looking positive. Nuff said about that.
As for the Dow Jones and its step sum chart, as seen within the red circle, they both have developed a bearish downward trend. But as also seen in this chart, having these plots take a bearish downward trend is something they’ve done before since their 20 March 2020 bottom. Should these down trends continue, it would be very bad. However, unless the market sees some extreme-market events in the days and weeks to come, I’m going to remain short-term bullish on the stock market.
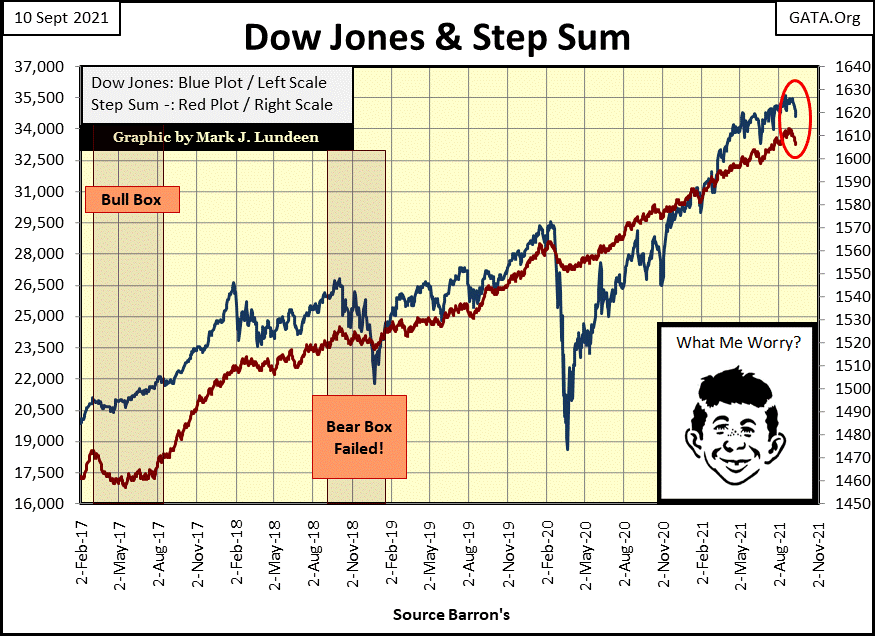
Moving on to gold and the Dow Jones step sum tables below. Both markets have come under selling pressure in the past few weeks. Not so much for gold, as for the most part the down days were soon matched by an equal number of advancing days. But on August 25th the Dow Jones’ 15 Count saw a +7, which is an overbought market, a market due for a pullback. And that is what happened with the Dow Jones, beginning the day after it saw its +7 for a 15 count. How much longer before we see a rebound in the Dow Jones?
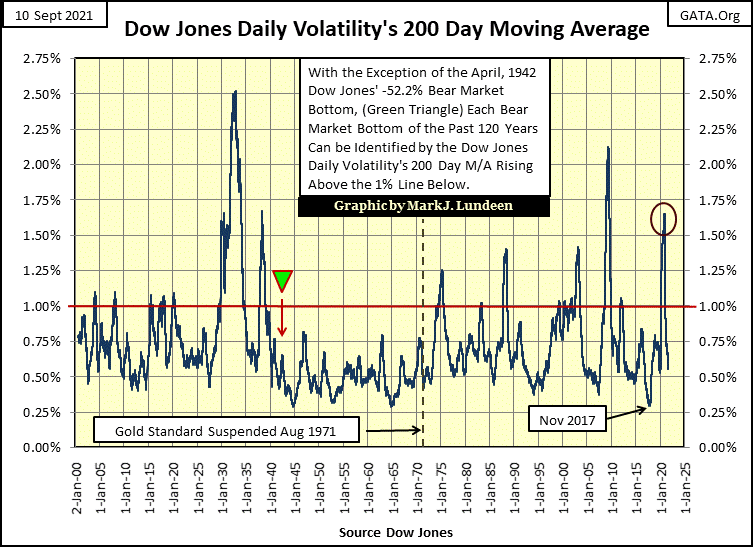
The Dow Jones daily volatility’s 200-day M/A decreased to 0.55% on Friday’s close. What does that tell us? Let’s look at this market metric going back to January 1900, 120 years of market history in the chart below.
With the exception of the April 1942 bear market bottom, one can trace every market advance and decline the Dow Jones has seen since 1900 in the chart below by using the following rules;
Bull markets advance as daily volatility DECREASES from one extreme to another,
Bear markets decline as daily volatility INCREASES from one extreme to another,
And Big-Bear Markets bottom as they push daily volatility’s 200-day M/A to something above 1.00%.
Looking at the 120 years of market history below, and seeing the Dow Jones daily volatility’s 200-day M/A decline to 0.55% at the close of this week, forces me to stay short-term bullish on the stock market.
But as seen from 01 January 2020 to late March 2020 (Red Circle), the situation in the stock market can change very quickly. Dow Jones daily volatility’s 200-day M/A shot up from 0.53% to 1.65% in just a few weeks during the March 2020’s 38% flash crash. And note how from its 1.65% March 2020 high (at the start of the Dow Jones current 86% advance), daily volatility’s 200-day’s volatility has now declined to 0.55%.
I’m anticipating the Dow Jones will continue advancing as its daily volatility continues declining * UNTIL * the Dow Jones once again begins seeing its days of extreme volatility; the dreaded Dow Jones 2% days. I believe that because of what I’m showing my reader in the chart below; 120 years of market history of precisely this.
As far as it goes on gold’s side of the table below, it’s a bit boring. Like the Dow Jones, I’m waiting for gold to see an uptick in its days of extreme volatility; gold’s 3% days. But unlike the Dow Jones, a big increase in gold volatility’s 200-day M/A to something above 1.00% would be very beneficial for us gold bulls.
Mark J. Lundeen
*********


