The Magic Number


Gold Market
Last week's trading saw gold forming its low in Monday's session, here doing so with the tag of the 1873.00 figure. From there, strength was seen into late-week, with the metal pushing up to a Thursday high of 1904.90 - before backing slightly off the same into the weekly close.
From the comments made in past articles, the next good rally phase for gold should come from our dominant mid-term cycle, the 154-day component, shown below:
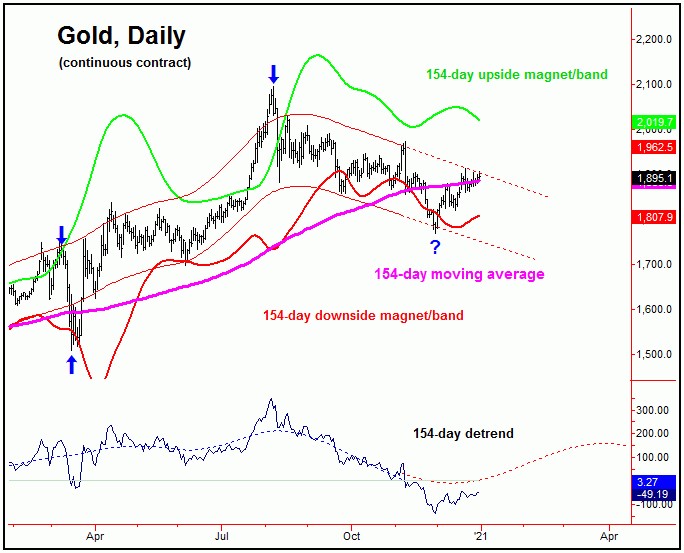
In terms of price, any firm push on above the 1912.00 figure for gold - if seen at any point going forward - would start to favor a breakout towards our upper 154-day cycle band in the weeks to follow. On our 154-day cycle chart, we can see the current consolidation just below the upper 154-day channel, which is why the 1912.00 figure looks to be the next key level to overcome.
Though a push up to the upper 154-day cycle band is favored to materialize in the next month or two, the eventual path for the bigger picture is looking for a move into our open four-year target zone of 2212.00 - 2340.56. Having said that, there will be the normal bumps-and-grinds along the way. That is, there will be another low due around late-Spring of this year, which will come from the larger 310-day wave:
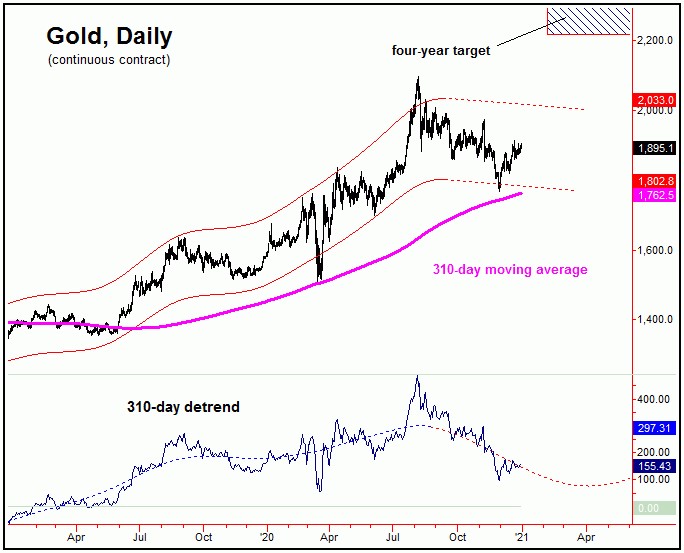
With a cycle having the strong tendency (i.e., 85% or better odds) of reverting back to a moving average of the same length, the 310-day moving average will act as an eventual downside magnet going forward.
Having said that, with this 310-day wave not projected to trough until April or May, this 310-day moving average - which is trending to the upside - will be at a higher level at that time, and thus the ideal path would be looking for a secondary low as this 310-day wave next troughs. I am currently working on a detailed forecast for the gold cycles in 2021, which will be released on or around mid-January.
S&P 500 and the Magic Number
From the comments made in past articles, the bigger cycles in U.S stocks are pushing firmly higher in U.S. stocks well into the year 2022 or beyond. This again is due to the position of the four-year cycle, which is shown again on the chart below:
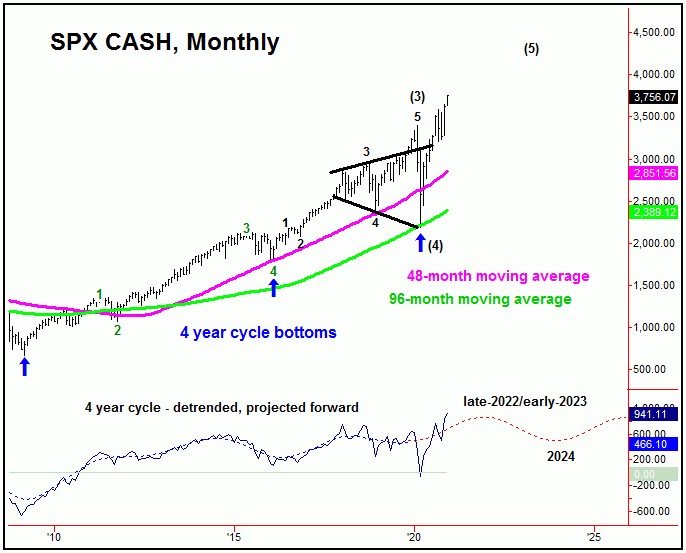
As mentioned in some past articles, the average price rallies with this four-year wave in the past have been around 100% from trough-to-peak on the SPX, which suggests that the 4400's will eventually be seen. The next larger-degree peak should come from this same four-year wave, ideally made on or sometime well past the Spring or Summer of 2022 - though a 2023 high may be more ideal.
So what is the magic number? The magic number for the SPX is 5000. That is, once the market is in a major bullish phase - as is the case here - then big round numbers will normally act as price magnets. With the huge money printing from the Fed, the next logical magnet for this index is the round-5000 figure.
And, while I am not suggesting we will see the SPX trading at the 5000 figure in the coming months, I do see it as an ideal magnet before the larger bull market phase is complete.
It All Ends Badly
Having said the above, just as in the fairy tale, all the king's horses and all the king's men couldn't put Humpty Dumpty back together again. The same will hold true for the U.S. economy - and the stock market - upon completion of the current bull market phase. That is, the Fed can't save the world though money printing - and their current action is setting the stage for the eventual ruin of the both markets and economy.
Going further with the above, upon completion of the larger bullish phase, the U.S. stock market is likely to decline from 60-80% from its highs - worse than either of the declines seen into the 2002 or 2009 major lows for stocks. What must be seen first, however, is for the current 'blow-off' to conclude, which may not finish until the SPX reaches the 5000 level or better in the next year or so.
We know from history that money-printing always results in price inflation - which is the disastrous end-result from the fed actions. We are already seeing that in the cost of most goods right now - with most grocery bills having risen 20-30% from what they were just one year ago (checked your grocery tab lately?).
For now, it will pay to stay ahead of inflation - which can only be done with proper timing of investments. That is, enjoy the bull market, and run along with it! By the same token, be ready to run for the hills once it is said and done - and there should be certain technical signs that show up before it nears completion.
Looking Back at 2020
The chart below shows our original pattern/path forecast for the SPX for the year 2020, which was published back in January of last year:
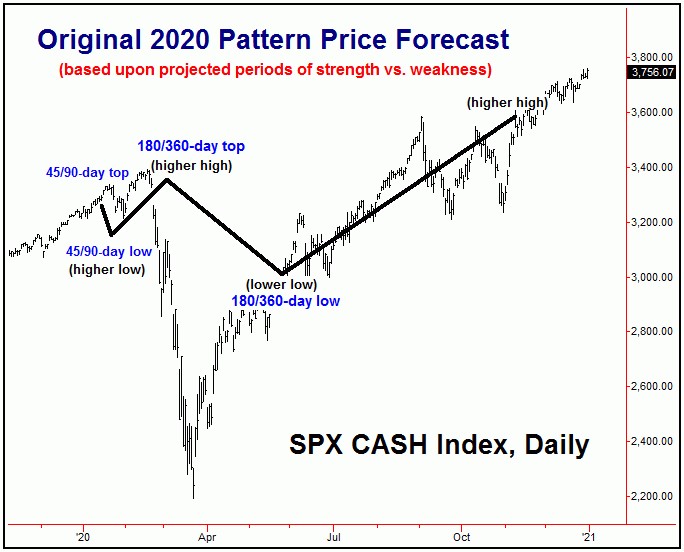
The overall path for 2020 suggested a correction into mid-to-late January, one that would be followed by a higher high into late-February - which we did see. From there, the path projected a sharp correction into the month of May, which would come as a result of the 180 and 360-day cycles that we track. While that correction did come as projected, what was not known was the magnitude of the expected decline, which was the obvious 'rogue wave' - coming from the COVID-19 virus.
Going further, the SPX dropped some 35% from peak-to-eventual-trough into late-March, giving us an earlier-than-expected trough for the 180 and 360-day cycles, which also turned out to be a low for our larger four-year wave. From there, the cycles forecast a sharp rally into late-year, which we obviously saw - and were able to forecast accurately in our daily and weekly Market Turns reports.
Looking Ahead Into 2021
As for the current year 2021, as mentioned earlier we are obviously expecting higher prices for U.S. stocks - and a continuance of the bigger bull market, with the potential for a push up to the 4400's or better on the S&P 500 index. However, we do expect it to be a wild-swinging year in-between.
With the above said and noted, I am in the process of finishing up our 2021 cyclic forecast for the U.S. stock market, which will post the precise dates we are looking for key tops and bottoms to occur. For the year 2020, in simply buying the SPX at these projected low dates - and reversing (and going short) at the projected high dates - the overall net gain would have been around 1342 SPX points, or around 29.7% for the year. This is excellent, considering that 2020 was one of the hardest years to forecast - and to trade - in well over a decade or more. Best wishes for a better 2021!
Jim Curry
The Gold Wave Trader
http://goldwavetrader.com/
http://cyclewave.homestead.com/


