A Major Cycle Trend Turn Window Is Approaching For The Stock Market


There are three independent cycle turn indicators all identifying the period from November 26th through December 6th as a high probability for a stock market trend turn. The direction of the stock market trend going into this period will be reversed. The fact there are three cycle turn indicators saying the same thing might suggest that a significant new trend will begin in this timeframe.
The first cycle indicator is the Bradley model turn date of November 29th +/- a few days. In 1948 Donald Bradley wrote a book called “Stock Market Prediction: The Planetary Barometer and How to Use It.” This book presented a tool known as the Donald Bradley Siderograph, which is intended to leverage “the potency of major planetary aspects…to prove the correspondence between planetary operations and market responses.” The term “siderograph” means star graph. The ancients saw planets as “wandering stars,” which is how they developed the predecessor word for “planet” in ancient Greek (i.e., “astēr planētēs”).
The Bradley Siderograph is one of the most interesting and popular forecasting methodologies in the field of Financial Astrology. This field involves leveraging astronomical and astrological data to understand and forecast activity in the financial markets. However, Financial Astrology is far broader and richer than this methodology alone, and its origins date back several thousand years.
The Bradley model siderograph is typically used to identify turning points (i.e., trend reversals) in the market over the medium- to long-term rather than predicting the exact movement of the market across time. Turning points include inversions, which occur when the stock market bottoms when the siderograph tops, or vice versa. Therefore, turning points in the siderograph can indicate both tops and bottoms in the stock market. Also, siderograph turning points typically indicate market turning points within 4-7 calendar days rather than being exact to the day of the turning point. Sophisticated market professionals use the Bradley siderograph in conjunction with other fundamental and technical market factors rather than using it alone to inform their trading decisions. (1) https://bradleysiderograph.com
In the first book of the Bible, Genesis Chapter 1, verse 14, we see that one of God’s key purposes for creating the sun, moon, stars and planets was for “signs.” 14 ‘Then God said, “Let there be lights in the expanse of the heavens to separate the day from the night, and let them be for signs and for seasons and for days and years;”’
The second independent Cycle Indicator is one we developed at Dr. McHugh’s Main Line Investors, Inc.’s www.technicalindicatorindex.com almost two decades ago, which has been remarkable at identifying high probability cycle tops and bottoms in the stock market. We call it our Phi Mate turn date analysis, which currently is identifying December 5th, 2019 +/- a few days as a high probability stock market top or bottom, with a new trend likely to start around then. This analysis identified the inflation adjusted all-time top in the stock market on January 14th, 2000 as an important tentpole for the stock market. This methodology identifies every day each year that occurs the number of trading days from a prior significant high or low in the stock market that are a Fibonacci 61.8 percent of the number of trading days that have transpired since January 14th, 2000. These dates have a high probability of identifying coming highs and lows in the stock market. The theory here is that the mathematical ratio Phi has a unique occurrence throughout the universe, and therefore affects the stock market as well. This ratio is prevalent between each of the numbers in a Fibonacci series of numbers. That sequence starts at 1, and adds 1 to itself to get 2, the we add the previous two numbers to get the next number, 3 (1 + 2), then we get 5 (3+ 2), then we get 8 (5 + 3), then we get 13 (8 + 5), then 21 (13+ 8), then 34 (21 + 13), and so on. Now if we divide two consecutive numbers in this sequence, we obtain the important ratio .618, or 61.8%. For example, if we divide 21 by 34, we get .618. If we divide 34 by 55 we get .618 again, which is Phi.
Phi ratios and Fibonacci numbers are seen everywhere. For example, the most pleasing to the eye picture frames will have their length and width a Phi ratio of .618. Architects tend to design buildings with this ratio in mind for structural soundness. The body of a human has 1 head, two eyes, two arms, two legs, five fingers, five toes, all Fibonacci numbers. The spirals of hurricanes and galaxies form from Phi ratios. The Phi ratio .618 is know as the golden ratio in mathematics.
The point is, this ratio is also important in stock market movements. It is quite often a determinant of market tops and bottoms.
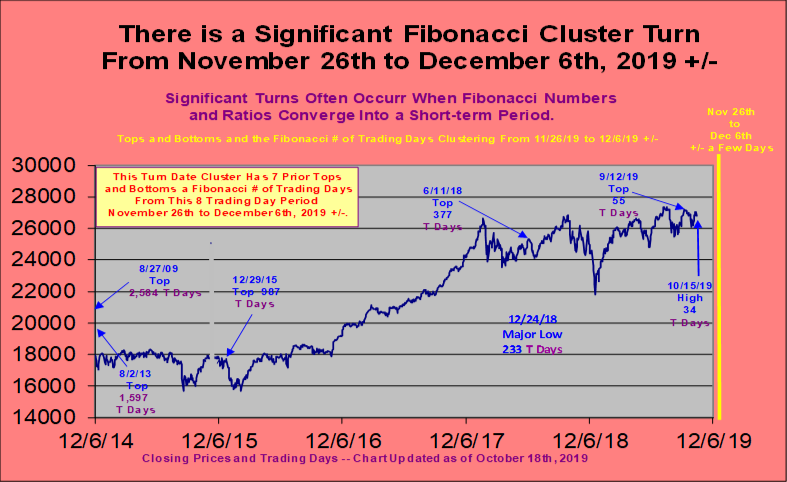
The third cycle identifier, independent of the Bradley Model and the Phi mate cycle turn dates, is what we call Fibonacci Cluster turn windows. Above we show a chart of the next cycle turn window, which is set up for the period from November 26th, through December 6th, most interestingly, the same period as the next Bradley model and Phi mate turn dates are forecasting. Here, we identify narrow periods of time, usually a week, where we see a high number (usually 5 or more) of prior significant tops or bottoms that are a Fibonacci number of trading days away from this time period. This coming cluster window has a large number, seven, or prior tops or bottoms a Fibonnaci number of trading days from November 26th, 2019 through December 6th, 2019.
November 29th, 2019 is a Fibonacci 2,584 Trading Days from the 8/27/09 top.
November 27th, 2019 is a Fibonacci 1,597 Trading Days from the 8/2/13 Top.
November 27th, 2019 is a Fibonacci 987 Trading Days from the 12/29/15 top.
December 6th, 2019 is a Fibonacci 377 Trading Days from the 6/11/18 Top.
November 26th, 2019 is a Fibonacci 233 Trading Days from the 12/24/18 Bottom.
November 29th, 2019 is a Fibonacci 55 Trading Days from the 9/12/19 Top.
December 3rd, 2019 is a Fibonacci 34 Trading Days from the 10/15/19 Top.
In conclusion, we believe these three cycle turn date methodologies, in concert, are telling us a significant new trend is going to start around the week of November 26th to December 6th.
At McHugh’s www.technicalindicatorindex.com we track the short-term waves that make up these larger degree trends, and chart them in our forecast newsletters, and have developed several proprietary Buy/Sell indicators that help us identify when the next significant move is starting for the Stock Market and Mining stocks, and in which direction the move will develop, which are also helpful to forecast moves in Gold and Silver. We publish these indicators in every Daily Newsletter to subscribers.
*********


