Market Events Few Are Watching
 share
share
 share
share
 share
share
 share
share
 share
share
Markets are not nature's creation, whose movements and events are definable with mathematical precision. Markets are human creations, subject to the emotional swings of the buyers and sellers. This is true from market bottom to market top; and back to the bottom again. To understand markets, one must understand human psychology, and to understand human psychology, one only has to remember their high-school days where what was in or out, good or bad, smart or dumb was decided by whatever peer group they identified with. Those rare individuals who think for themselves, rejecting the opinion of the group, usually find themselves a lone-wolf in human society. This is especially so in the market place.
James Turk in a recent interview with Eric King gave one of the best definitions of a financial bubble, in human terms.
"When there is a bubble in the markets, people are either not paying attention or accept as conventional wisdom, premises that do not stand up to logic or any kind of rational analysis." -- James Turk
In other words, people tend to choose the reassurance of the herd rather than think for themselves when it comes to investment decisions they make in the markets; Exhibit A: the unbelievable earnings of the Dow Jones Industrials.
For the past five years the earnings for the Dow Jones have been totally out of control! Within the green rectangle below; between November 2007 to July 2008, we see the Dow's earnings dropping from $840 to -$100, a full $940 collapse into negative territory, in only nine months! That's bad, but what's even worse is seeing the Dow's earnings rise up from the grave, over $1000 from its low of 2008 to new all-time highs in January 2012. We are looking at the Dow Jones earnings here, not some startup technology company. To anyone with any knowledge of the state of today's economy, these numbers appear to be just too good to be true.
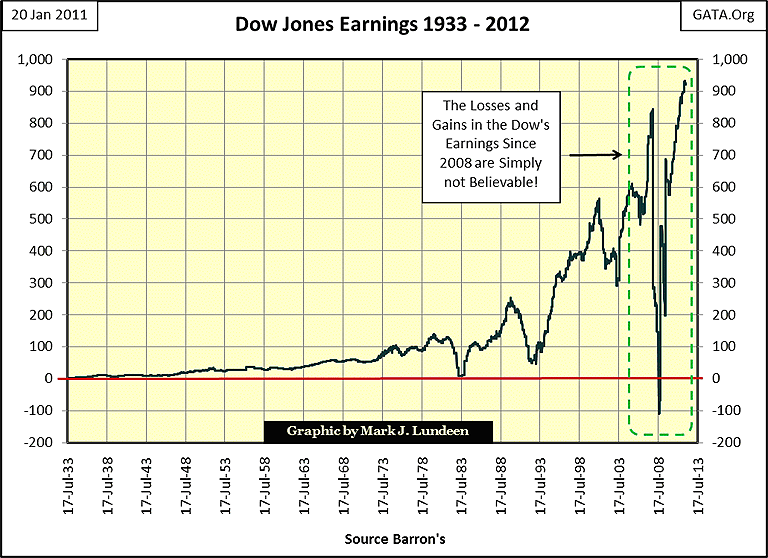
What makes these numbers so suspicious is the emphasis placed on corporate earnings in today's financial media. From the start of my earnings data in 1929 to the Greenspan Fed, the connection between stock valuation and earning trends were at best weak. Then in the 1990s, earnings trends became an all-consuming fetish in the financial media that had no historical basis. However, since the early 1990s, herd mentality soon made it so. Today, if Washington want's a bull market, somehow they have to make earnings trend upwards, exactly as we see above.
The obvious question is, since November 2007 "what the hell happened?" I don't exactly know, but I do have some idea. General Motors started the Dow's earnings collapse in late November 2007 when GM's GMAC division's portfolio of mortgages sucked the life out GM's earnings. In reality, GM felt compelled to enter the mortgage business because most, if not all of its profits from manufacturing automobiles went to their unions' wages and benefits. When the mortgage market froze up in the summer of 2007, GM's business plan became as obsolete as Lehman Brothers and Bear Stearns, and for the same reasons: US Mortgages. In early 2009, President Obama kicked a good man (GM) when he was down, when our president circumvented centuries of bankruptcy law, and nationalized GM's assets, gifting much of the plunder to its unions.
But GM was only one of thirty companies listed on the Dow Jones Industrials, and most of the listed companies in the Dow Jones also saw their earnings collapse, but why?
Well, look at what earnings are; dollars remaining after expenses are paid. I suspect that in the nine months from November 2007 to July 2008, corporate profits from actual operations in the Dow Jones companies were little affected as their earnings collapsed. If someone were to do a little digging around, I expect they would find the Dow's companies' cash positions during this period were not cash at all, but AAA rated interest bearing mortgage instruments, recommended to the companies' by their investment bankers, that defaulted on their interest and principle payments, plus a Credit Default Swap (CDS) package sold to them by their investment banker that cratered.
In a world where such things are possible, and they are, should we be surprised seeing corporate profits recover so quickly, as the dollars these companies earn are only what the "policy makers" say they are? A few changes in the accounting rules, and new derivative packages from their bankers can explain much of the current rise in the Dow's earnings during a period of time that is looking more like the 1930s every day. Thinking for myself, I suspect that the current earnings and prices in the general-stock market are mostly fraudulent, and vulnerable to another collapse.
My expectation is that it's only a matter of time before the step sum once again collapses, taking the NYSE Financial index down with it. But keep in mind that in one way or another, Europe's banks are closely connected to these companies. That, plus the solvency issues these American financial companies had in 2008-09 have never been resolved, only repackaged and rolled over in the OTC derivatives market. So bear box or not, I expect the lows of March 2009 will be taken out in a big way sometime in 2012 or 2013.
Should we purchase put options based on this information? Hell no! I am not now and never will be an investment advisor. Everything I write is my personal market research; which I share with others on the internet. That said, purchasing put options in this market is fraught with danger, as you may discover that a winning put on one of these companies, comes with one of these problem companies standing as your counter-party. In such an event, your puts become worthless as bankrupt banks can't make good on their debts to counterparties.
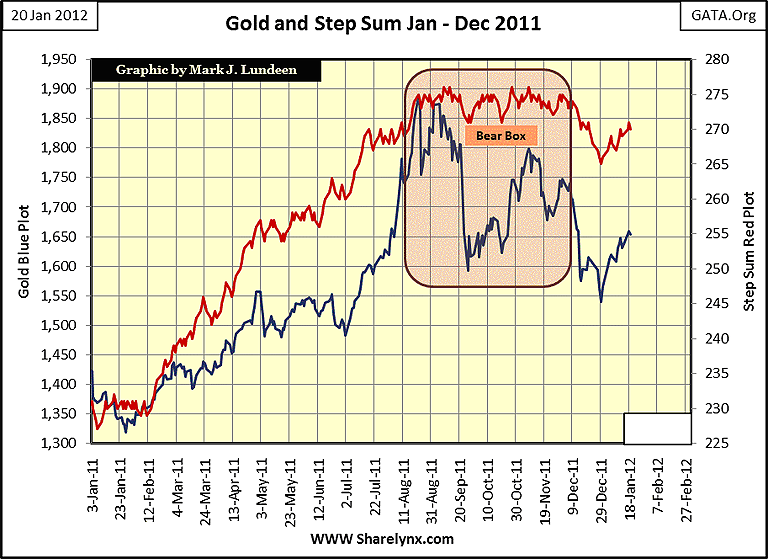
Here is another bear box, for gold, one that worked out picture perfect. From the start of 2011, gold and its step sum advanced to their highs of early August, when the price of gold began a four month retreat as its step sum trended sideways. In early December, the 24 hour gold-bug suicide hot lines were ringing off the hook as the step sum collapsed, taking the price of gold down to its correction lows. Seeing the price of gold and its step sum bounce off their lows, and now advancing together is a solid indication that the next advance in gold has begun.
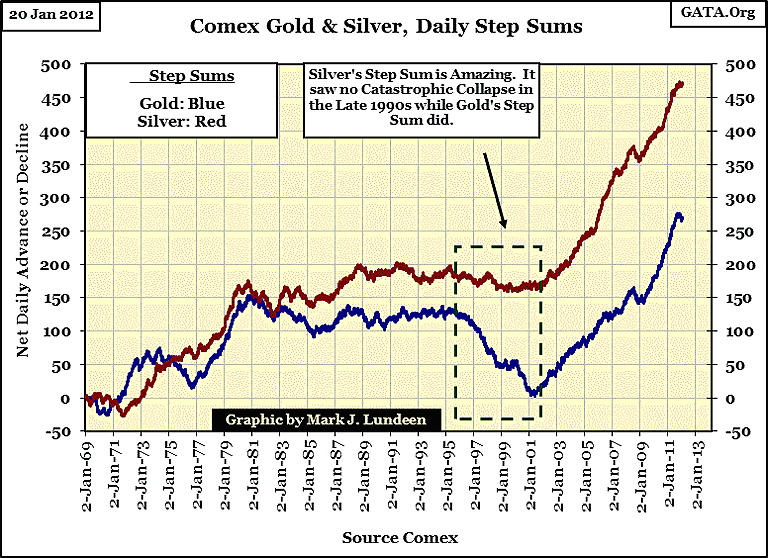
I would do a step sum chart for silver, but silver's step sum never seems to collapse! In the step sum chart below, silver's step sum from 1969 to 2001 looks much stronger than gold's, however gold's steepest price decline in its 20 year bear market was only 68%, compared to silver's catastrophic 92% collapse from its 1980 high! Look at the 1996-2001 catastrophic collapse in gold's step sum! Gold's 2001 step sum bottom marked a solid bear market bottom, and the beginning of a long bull market that has many years, and dollars to go.
Foreign central banks are reducing their exposure to US Treasury Debt, with good reason, and this is not good for the stock and bond markets. For the people out there who believe the current market rig will go on forever, seeing an actual reduction of 2.67% in the US T-debt portfolios of foreign central banks for the first time in a decade should tell you that the market rig is closer to its end than its beginning. Since August 2011, this plot has yet to see a new BEV Zero, so maybe the August 2011 BEV Zero will prove to be the Terminal Zero; the last gasp of the dying bull in Treasuries and the peak appetite for US T-debt in global monetary history.
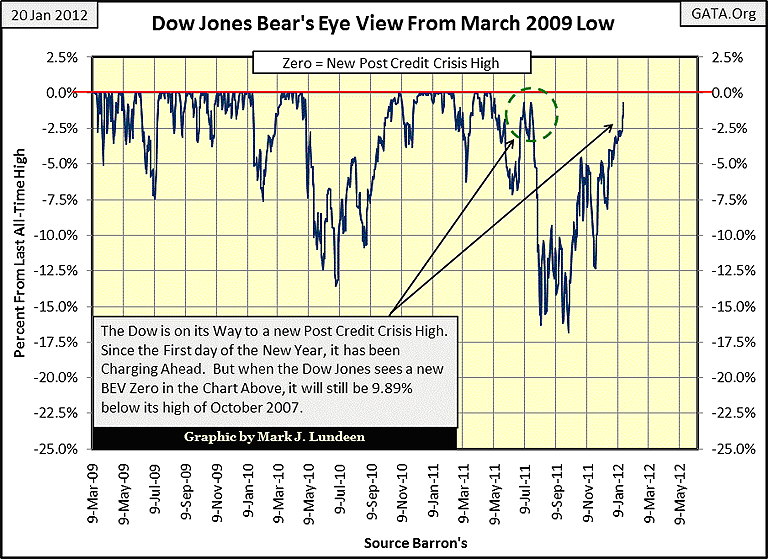
But QE3 has yet to be announced and most likely won't be until the Dow Jones is once again under pressure. But as we see in the chart below, the Dow is doing fairly well, looking like it may soon make a new post-credit crisis high, as early as next week. It had better do so by April, since as of Friday January 20, it is only 0.70% from doing so. If it should fail to make a new high of the move, rolling over instead as it did twice last July, it would be a really bad sign of things to come. Personally, with a little help from its friends, I think the Dow can manage to do what it twice failed to dolast summer, exceed the highs of last April.
However, even if the Dow Jones does rise above the high of last April, it doesn't mean there is a new bull running around the NYSE. It's been three years since March 2009, plenty of time for the 3100 companies listed on the "Big Board" (NYSE) to begin making lots of new 52 Wk highs.
So, what's next for the financial markets? If EP continues sinking like a stone, paper assets have nowhere else to go but down!
One thing for sure, if EP continues its current trend, the bubbles Washington has inflated in the financial markets are going to deflate, whether the "policy makers" like it or not. It's hard believing that gold and silver could do anything other than go up, as the price of everything else goes down in a general flight from paper assets.
Mark J. Lundeen
[email protected]
[email protected]
share
share
share
share
share


