Market Timing For Major Markets


SPX: Long-Term Trend - Bull Market
Intermediate trend – SPX may have started an intermediate correction
Analysis of the short-term trend is done on a daily basis with the help of hourly charts. It is an important adjunct to the analysis of daily and weekly charts which discusses the course of longer market trends.
A CRITICAL WEEK AHEAD
Market Overview
We are quickly approaching the time frame when SPX must confirm that it is capable of making a new high. Friday’s inability to extend its current uptrend decisively was already a big negative. Next week, it will have a final chance to redeem itself with some positive action which can begin to erase the negativity displayed not only on Friday, but for the past few weeks…
NASDAQ and SPX are the only two major indices which are still behaving relatively well, and SPX is quickly losing it! Of the others, the DOW Composite was the first to establish a downtrend. The DJIA may have joined it last week, and the New York Composite Index is not far behind. In the face of this showing, SPX might find it easier to join the crowd than to go against it. Even the NASDAQ looks as if it just made a buying climax! OH, I forgot! IWM and MID are not looking so hot, either.
As you can see, it’s not just SPX that has work to do to turn positive, it’s the whole caboodle!
Indicators Survey
Since the Weekly SPX MACD broke its uptrend line from October 2011, it has been in a steady decline and it is getting closer and closer to going negative. When it does, it will be the final nail in the coffin to confirm that the index is in an intermediate downtrend. The DOW Comp’s already went negative several weeks ago, and DJIA’s is closer to the zero line than SPX.
The daily indicators all bounced with the rally but are beginning to roll over.
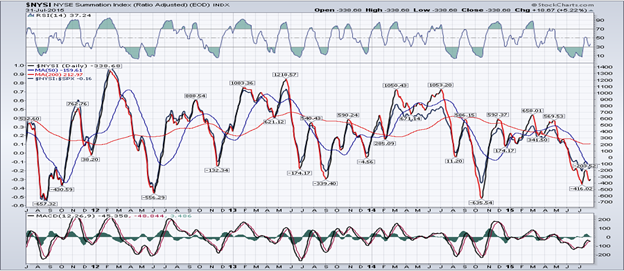
This is a quiz: can you find the current rally in the summation index (courtesy of MarketCharts.com)? Enough said!

“The 1X P&F filled a phase projection to 2078 on Friday, but the top distribution pattern has potential lower counts.” Until the 2132 top is surpassed, those lower counts are still in effect. The current pattern of distribution may be in the process of confirming the lower targets.
The 3X3 chart went from 2055 to 2130 without a single reversal. It also came back down to 2064 without a reversal. First time since I have been keeping this chart (about 4 years) that I have seen this kind of volatility!
Chart Analysis
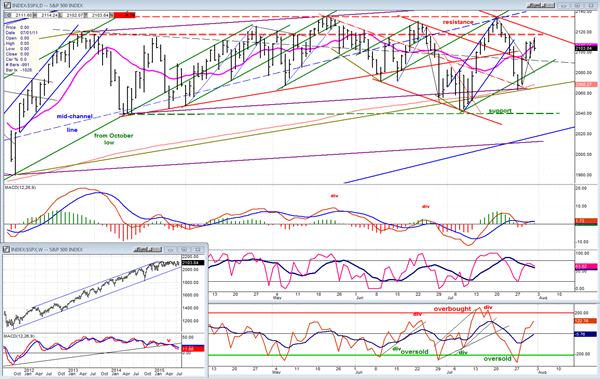
The Daily SPX (chart courtesy of QCharts.com as others below) is trying to establish a downtrend, but it has not quite succeeded yet. Next week should be its chance to prove that this is what it is doing. The lower lows are already in place (connected by a red trend line) and all we need is for the current rally to fail at or below the top red parallel, and for prices to head south again. This would set up another attempt at breaking through the 200-DMA. It has already been tested twice and you know what they say about the third time!
The sideways move for the past several months has created a strong resistance zone at the top and support at the 2040 level. For a trend of larger duration to take hold, the index would have to penetrate one or the other and keep on going. My bet is that, for the foreseeable future, breaking support has much better odds than overcoming resistance.
The insert of the weekly chart shows how, after a long period of deceleration and negative divergence, the MACD has declined steadily since it broke its uptrend line. It would take strong and sustained market positives to reverse that trend. The daily momentum indicators started to roll over after the price stalled just below the resistance level. The A/D indicator is still moving up, suggesting that a little more distribution might have to take place at this level before the start of a downtrend.
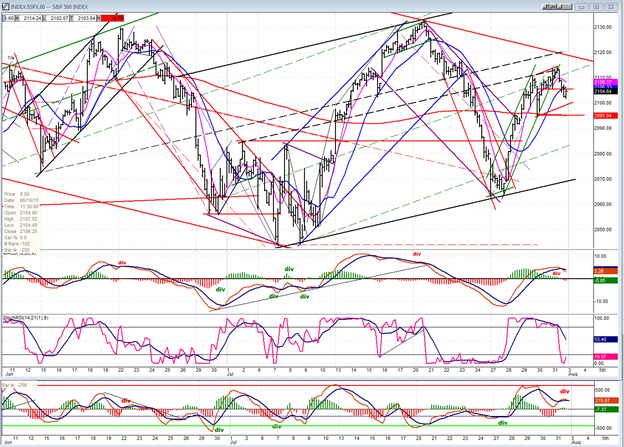
The Hourly chart shows that the index, which has been in a low grade uptrend since early July, seems to be running into some resistance just above the mid-channel line. The red line above is a tentatively drawn channel line which is a parallel to the one connecting the last two lows (you can see this better the daily chart above). If SPX fails to rise above that line, it will have taken another step towards confirming that it is establishing a downtrend; and if it breaks below the recent low of 2064, it will be one more and final step.
In order to suggest that it has started another challenge of the highs, strong buying must start right away or after a minor pull-back. Since the SRSI has already given a sell signal and the other two oscillators have already started to turn, these are signs that the upside momentum has already been arrested.
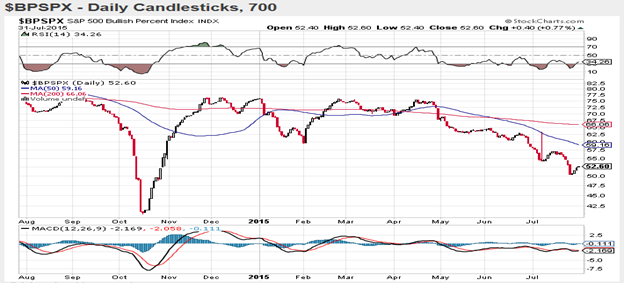
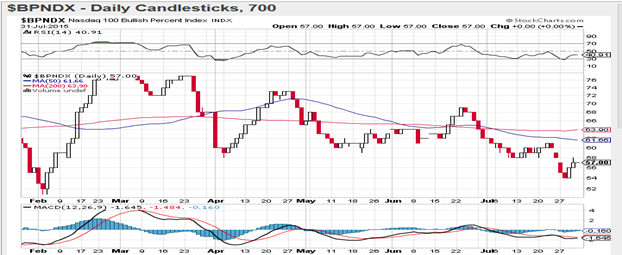
The following two charts are very revealing when compared with their respective index charts. To begin with, they are both relatively much weaker. Also, BPNDX has shown more weakness than BPSPX since May, even though the NDX has been the strongest index among all those which make up the entire stock market. What is made obvious is that these two indices are distorted by the performance of a few high price stocks while a good percentage of their stocks are already correcting.
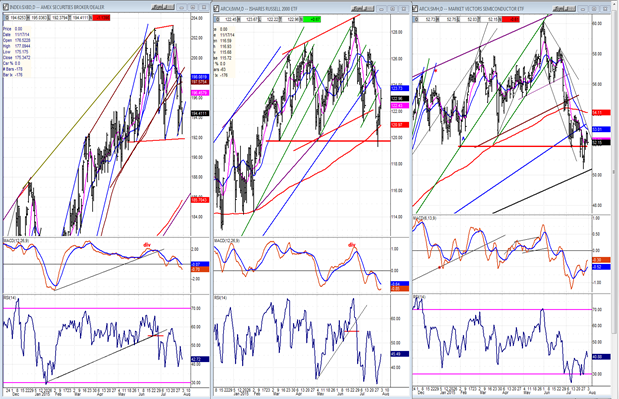
XBD -- IWM – SMH
As I have mentioned several times, these three indices are supposed to be market leaders and it looks as if they are just beginning to lead the market on the downside – at least IWM and SMH are. All three are showing recent negative relative strength to SPX in increasing order of weakness from left to right.
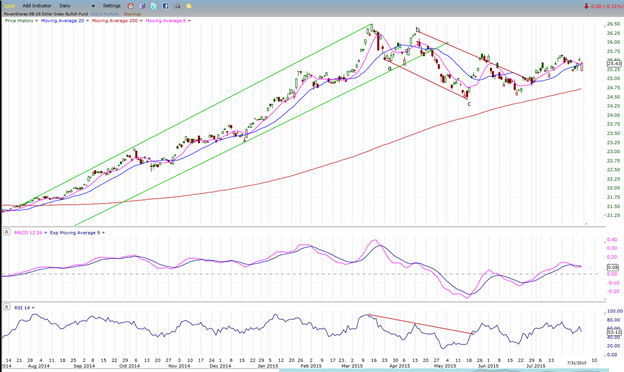
UUP (dollar ETF)
On Friday, UUP looked as if it were desperately trying to avoid another down leg in its consolidation pattern. If it cannot follow through on the upside early next week, it may have to continue the corrective pattern which started after the March top. If so, this could have some implications for the next two indices. Both tend to run contrary to the dollar.
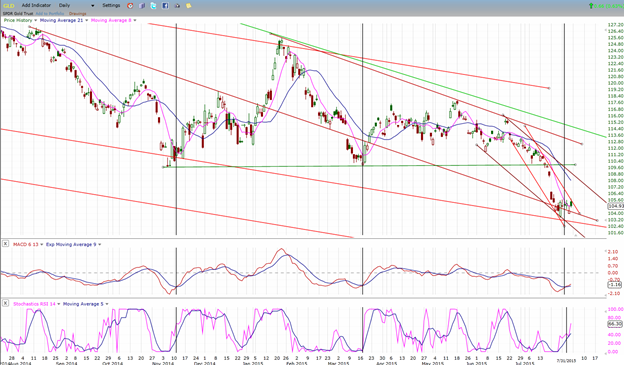
GLD (Gold Trust)
The start of a correction in UUP could be especially beneficial to GLD which has arrived at a cycle low and looks ready to bounce up. Notice the similarity between the current price pattern and the condition of the oscillators, and that of the two former short-term lows.
A short phase count on the P&F chart 104 (which GLD has now touched twice) seems to have halted the current decline of GLD. The total count is 100-101, but that may not prevent an oversold GLD to have a bounce to 107-108 before reaching that lower target. It would be even better if it retraced one more time to 104; but considering the position of the indicators which have already turned, the price could follow at any time.
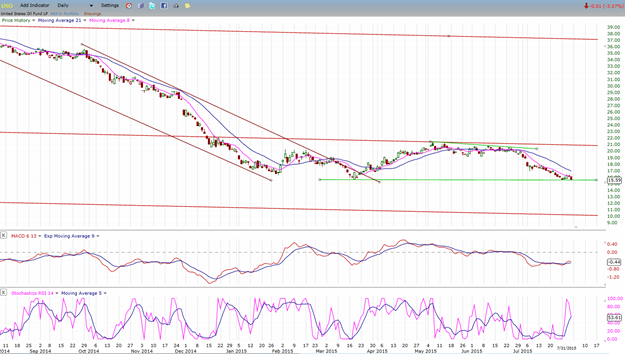
USO (US Oil Fund)
USO is also in a position to benefit from a retracement in the dollar to halt its decline in the vicinity of its former low. It’s less than a point away from a phase projection of 15.
Summary
My last newsletter was entitled “BULLS BEWARE”! In the above analysis, I have attempted to show that in spite of last week’s rally, nothing has really changed and time is running out for the bulls to show that they have the wherewithal to take the SPX to a new high. If they can’t, it is likely that the bears will have won the tug-o-war that has been on-going for the past five months!
********
FREE TRIAL SUBSCRIPTON
Market Turning Points is an uncommonly dependable, reasonably priced service providing intra-day market updates, a daily Market Summary, and detailed weekend reports. It is ideally suited to traders, but it can also be valuable to investors since highly accurate longer-term price projections are provided using Point & Figure analysis and Fibonacci projections. Best-time reversal estimates are obtained from cycle analysis.
For a FREE 4-week trial, send an email to: [email protected]
For further subscription options, payment plans, weekly newsletters, and for general information, I encourage you to visit my website at www.marketurningpoints.com . By clicking on "Free Newsletter" you can get a preview of the latest newsletter which is normally posted on Sunday afternoon (unless it happens to be a 3-day weekend in which case it could be posted on Monday).
The above comments and those made in the daily updates and the Market Summary about the financial markets are based purely on what I consider to be sound technical analysis principles. They represent my own opinion and are not meant to be construed as trading or investment advice, but are offered as an analytical point of view which might be of interest to those who follow stock market cycles and technical analysis.

When Andre Gratian was a stock broker years ago, a friend introduced him to technical analysis of the market. Consequently, it is not an exaggeration to say that Andre fell in love with this approach! Ever since then, it has become an increasingly important part of his professional life. Gratian has studied the works of Wyckoff, Edwards & Magee, Edward J. Dewey (cycles) and many others. However, one of my most profitable undertaking has probably been to study Point & Figure charting, which he finds invaluable in analyzing stocks and indices. If he were restricted to one methodology, this is the one that he would choose. This well-rounded background has given him what he feels to be a special insight into the stock market, facilitating the recognition of meaningful patterns and the ‘turning points’ in all trends, whether they be short or long term. Andre feels very comfortable discussing the stock market and passing on meaningful information to others. His subscribers include individuals and money managers throughout the world. Moreover, his Newsletters are currently published on several financial sites, here and abroad.


